Figure 4.
Download original image
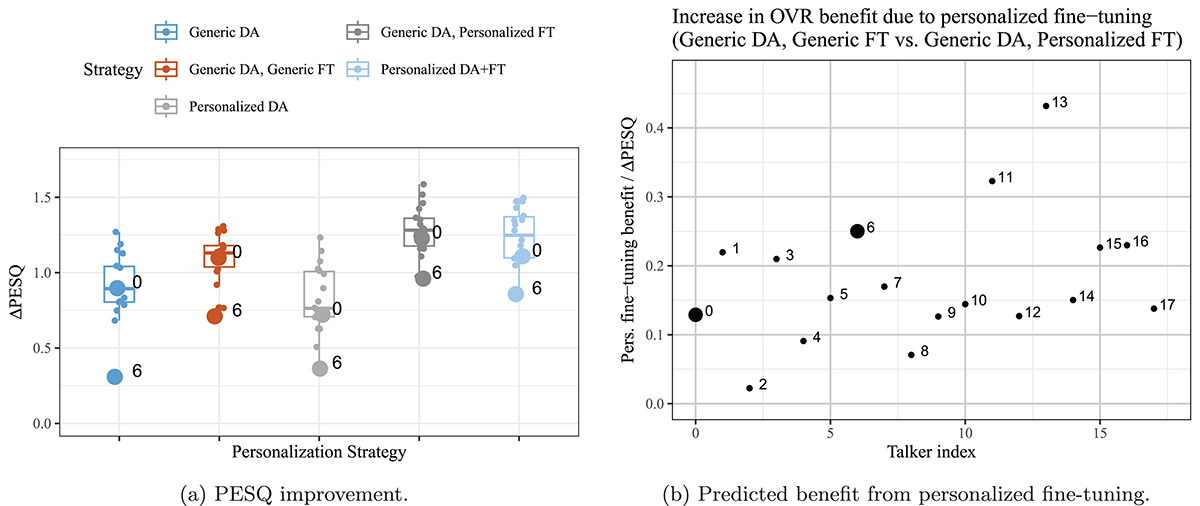
(a) PESQ improvement achieved by OVR systems trained with different personalization strategies in data augmentation (DA) and fine-tuning (FT) and (b) individual difference in PESQ improvement between the conditions generic DA, generic FT and generic DA, personalized FT. Individual data points denote the average over individual target talker test sets. The data points labeled with 0 and 6 correspond to the talkers selected for the listening experiment as the low predicted benefit and high predicted benefit, respectively.
Current usage metrics show cumulative count of Article Views (full-text article views including HTML views, PDF and ePub downloads, according to the available data) and Abstracts Views on Vision4Press platform.
Data correspond to usage on the plateform after 2015. The current usage metrics is available 48-96 hours after online publication and is updated daily on week days.
Initial download of the metrics may take a while.