| Issue |
Acta Acust.
Volume 9, 2025
|
|
|---|---|---|
| Article Number | 11 | |
| Number of page(s) | 14 | |
| Section | Noise Control | |
| DOI | https://doi.org/10.1051/aacus/2024081 | |
| Published online | 11 February 2025 | |
Technical & Applied Article
Simulation study on noise reduction of electric vehicle tire with built-in sound-absorbing material
School of Traffic Engineering, Nanjing Institute of Technology, Nanjing 211167, China
* Corresponding author: This email address is being protected from spambots. You need JavaScript enabled to view it.
Received:
28
February
2024
Accepted:
12
November
2024
Abstract
Tire cavity noise is becoming more prominent as the speed of electric vehicles is getting higher. This study aims to use a built-in sound-absorbing material to reduce tire cavity noise. First, the radial force was extracted by rolling analysis, and the tire cavity noise was obtained. Then, in order to investigate how the placement of sound-absorbing material affects the noise reduction, sound-absorbing material was applied to the inner side of tire’s side and tread position respectively. Finally, studies were done on the impact of sound-absorbing material’s density, flow resistance, porosity, and thickness on tire noise reduction. The best way to reduce noise with a 215/55R17 tire was to apply sound-absorbing material at side position. The density, porosity, flow resistance and thickness of the sound-absorbing material were 55 kg/m3, 0.95, 5000 Pa·s/m2 and 40 mm, respectively. The A-weighted sound pressure level decreased by 27.7 dB compared with that before the built-in sound-absorbing material. In response to the uncertainties on the reduction achieved by the sound-absorbing material, this study offers some recommendations for noise reduction of tire cavity. The studied effect is limited to the tire cavity, and the effect on the emitted sound energy has not been evaluated.
Key words: Electric vehicle tire / Tire cavity noise / Porous material / Finite element method / Sound pressure
© The Author(s), Published by EDP Sciences, 2025
 This is an Open Access article distributed under the terms of the Creative Commons Attribution License (https://creativecommons.org/licenses/by/4.0), which permits unrestricted use, distribution, and reproduction in any medium, provided the original work is properly cited.
1 Introduction
Electric vehicles have emerged as the primary driver of the global automotive industry’s transformation and growth, according to the most recent planning for the sector [1, 2]. With the improvement of the national standard of living, people’s demand for both automobile comfort and a better surrounding environment has also risen significantly, and this is inextricably linked to automobile tire noise. Because electric cars are generally quieter than conventional vehicles with combustion engine, tire noise is becoming more of an issue for them between 45 and 100 km/h [3]. Studying how electric vehicle tires reduce noise is essential.
Vibration and aerodynamic noise are the two basic types of tire noise [4]. The excitation force applied by the road surface causes the vibration and cavity resonance of the tire structure, which is the primary cause of tire noise and vibration. The air disturbance noise of the tire rotation stroke and the air column resonance noise between the tread groove and the road surface make up the aerodynamic noise.
Tire vibration noise has a relatively large impact on the overall acoustic emission of electric vehicles, but its importance is slightly different compared to tire rolling noise and tire-road surface contact noise. Tire rolling noise is the noise generated by tires rolling on the road surface, and is mainly related to the material of the tires [5], the tread pattern and the condition of the road surface. Rolling noise is especially noticeable at high speeds. Tire-road contact noise mainly originates from the friction and impact between the tire and the road surface, especially on uneven road surfaces. It is also affected by speed, road surface characteristics and tire design.
Due to the relatively quiet operation of electric motors, tire vibration noise becomes more prominent. The majority of tire vibration noise is low-frequency, occurring between 20 and 500 Hz. Noise in this frequency range has a greater noise impact on people inside electric vehicles, and has an impact on the acoustic comfort of pedestrians and residents. Noise in this frequency range can be recognized by the human ear, causing vibration of the eardrum and affecting hearing. In addition, prolonged exposure to noise in this frequency range can cause health problems such as headaches, insomnia, anxiety and stress, and therefore can have an impact on human comfort. In particular, noise in the lower frequency range can propagate more easily and can have a more direct impact on the human body, such as headaches and fatigue. Therefore, when designing and planning urban transportation systems, consideration needs to be given to reducing the impact of vehicle noise on pedestrians and residents in order to improve their acoustic comfort. This study primarily examines tire vibration noise since noise in this frequency range has a significant impact on cab occupant comfort. Unless otherwise specified, the noise referred to below shall mean vibration noise.
Figure 1 shows the sound generation mechanism of tire vibration noise. Under road excitation, the vibration of tire structure leads to resonance of tire cavity and sound radiation.
 |
Figure 1 Sound generation mechanism of tire vibration noise. |
According to the mechanism of tire vibration and noise, the reduction of tire vibration and noise can be studied from two aspects: suppressing the excitation source and improving the transmission path [6–9]. Kamiyama reduced tire cavity noise by adding a Helmholtz resonator to the rim [8]. Kim et al. used the finite element and boundary element methods to analyze the acoustic-vibration coupling between the tire structure and the air cavity, and obtained the conclusion that the optimization of tire contour size can effectively reduce the radiation noise [9]. Qiao et al. investigated the assessment criteria of tire vibration noise and the impact of sound-absorbing material on cavity noise using a finite element model and simulation test. The findings demonstrate that the goal of reducing interior cavity noise can be accomplished by modifying the tire tread hardness and structure stiffness parameters [10]. This will also lessen the driving force or restraining force on the road surface to the tire and eliminate the tire’s closed cavity gas’s resonance.
In addition, there are also many scholars on the tire built-in sound-absorbing material simulation research [11–13] and experimental research [14]. On the premise of ensuring the accuracy of the simulation model, most of the researches were conducted through simulation. Mohamed and Wang demonstrated that the resonance noise of a tire cavity can be decreased by adding a sound-absorbing material to the rim [15]. Although the mechanism underlying the effect remains unclear, Simone and Abom demonstrated that the cavity resonance can be successfully suppressed by introducing porous sound-absorbing materials into the tire cavity [16]. Zhou et al. investigated the relationship between the sound absorption coefficient of porous materials and the noise reduction effect [17] when various porous materials were applied to the inner surface of tires based on the tire force transfer rate model.
After studying a wide variety of common sound-absorbing materials with various types, qualities, and specifications, Yang and colleagues were able to determine the relationship between the materials’ thickness and noise reduction effect as well as how this effect at various speeds [18]. Wang and Wu investigated the impact of a given volume of sound-absorbing material on sound pressure under various installation positions using an acoustic simulation model, and he also proposed an electrical analogy theory based on the combination of sound-absorbing material and air gap that is used to reduce noise [19].
To sum up, there is still a great deal of unexplored territory in the theory and technology of vehicle tire noise reduction. This article examines the noise reduction of tires using different placements of sound-absorbing material. Next, tire rolling analysis and tire noise analysis are performed using the finite element method. Finally, a suitable noise-reducing method is chosen after the tire noise is synthetically assessed using various sound-absorbing material positions, densities, flow resistance, porosities, and thicknesses.
2 Tire radial force extraction
2.1 Establishment of tire finite element model
The tire noise reduction idea is verified in this research using the tire rolling noise simulation. The selection of grid spacing and grid density needs to be considered according to the specific simulation requirements and computational resources. In general, the smaller the grid spacing and the larger the grid density, the more accurate the simulation results are, but the longer the computation time is. Therefore, we need to choose the appropriate grid spacing and grid density according to the simulation accuracy requirements and the limitation of computational resources. Taking into account both computational time and accuracy, this paper ultimately settled on a finite element simulation model. The experimental modal verification has confirmed the precision of this simulation model, rendering it suitable for subsequent simulations on tire cavity noise.
In building a finite element model of a tire, this paper’s focus is on tire noise, therefore utilizing an analytical rigid body for the rim and road will simplify the analysis. Because tire models can faithfully replicate the relationship between tire performance and tire components, they are typically used for tire design purposes. As a result, a detailed modeling of the tire’s cross section is presented in Figure 2a.
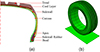 |
Figure 2 Tire finite element model. (a) Tire section model; (b) Rolling simulation model. |
The simulation takes into account the primary features of the tire model, including the composite properties of the tire cord, sidewall, and tread as well as the relatively significant deformation brought on by the elasticity of the tire body after contact with the pavement. Rubber is nonlinear and nearly incompressible. The tire model considers several tire components of different materials to meet the above characteristics. The belt is made of a linear elastic material with a high modulus. Rubber material is a hyperelastic material that captures incompressibility and nonlinearity [20, 21].
The tire used in this paper is 215/55R17. This type of tire is the most common type and can be used in a wide range of cars (such as Audi Q2LE-TRON SUV). Therefore, it is chosen as the object of study. As seen in Figure 2b, symmetric model generation and symmetric result transfer techniques are used to create a complete 3D tire model from a 2D tire model.
For the finite element model of tire, it is very important to determine the characteristic parameters of material accurately. Because the tire is composed of a variety of materials, including rubber, steel cord layer and rubber-cord layer composite material. Each material plays a different role in the tire: low modulus and high elongation of rubber materials used to maintain the pressure of the tire and improve the wear resistance of the tire and road grip performance; the cord with high modulus and low elongation is mainly used to bear load.
The Rebar model is used to simulate the cord layer and steel wire in the tire, which can more accurately describe the reinforcement effect of the cord layer and the steel wire on the rubber, and can directly calculate the internal force and deformation of a single cord layer, it is convenient to analyze the stress of tire skeleton structure. The material parameters of cord layer and steel wire used in this paper are shown in Table 1.
Parameters of cord layer and steel wire.
The rubber is modeled by the Neo-Hookean model, which is one of the most commonly used models for simulating hyperelastic material. The expression of strain energy density function is [22]:
 (1)
(1)
U is strain energy potential energy. C10 is shear modulus parameter. D1 is volume modulus parameter (i.e. incompressible parameter of finite element). I1 is strain tensor. Jel is elastic volume ratio. Given the shear modulus parameter C10 and the volume modulus D1, the properties of different materials can be defined. The Neo-Hookean model material parameters of the rubber component in the tire are shown in Table 2.
Parameters of the rubber component.
2.2 Validation of tire finite element model
In order to verify the correctness of tire finite element model, tire stiffness test, load characteristic test, ground characteristic test, modal test and so on can be used. In this paper, the acoustic characteristics of tire are mainly related to the tire modal characteristics, and weakly related to other mechanical characteristics. Therefore, the tire modal test is used to verify the accuracy of the tire finite element model. Table 3 displays the test apparatus along with its kind, name, and intended use. Figure 3 depicts the test environment.
 |
Figure 3 Tire modal test environment. |
Test equipment.
The first six modes of the test and simulation results are consistent. Table 4 lists the test and simulated results of the first six modes. The comparison indicates that there is less than 5% relative error between the test and simulated modal results. Therefore, the 3D tire model can be applied to the subsequent vibration and noise simulation.
Comparison of test and simulated modal results.
2.3 Tire rolling simulation
The radial force of tire ground position can be obtained by calculating the radial response force of stiff pavement. Thus, as illustrated in Figure 4, the tire radial force serves as the boundary condition for the tire noise simulation.
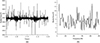 |
Figure 4 Radial force at tire ground position. (a) Radial force of tire ground position in time domain; (b) Radial force of tire ground position in frequency domain. |
The 215/55R17 tire chosen in this paper has a radial maximum load capability of 5300 N. Figure 4a displays a radial force of 4000 N and a load rate of roughly 75%, both of which are in line with the force characteristics of a single tire. As seen in Figure 4b, the radial force at the tire ground point is subjected to a Fourier transform in order to determine the noise. The resulting radial force in frequency domain is then transformed from the time domain. Tire structural vibration is the primary cause of noise below 500 Hz [23]. The research on vibration noise is conducted in the frequency range of 20–500 Hz because the lowest noise frequency that human ear can perceive is 20 Hz and tire vibration noise falls into the intermediate and low frequency noise categories.
3 Tire vibration noise simulation
3.1 Calculation of tire coupling mode
The radial force of a tire, which serves as the boundary condition for estimating the sound field inside the tire cavity, is derived by applying the finite element method to create the tire-road interaction model. The low frequency noise area of tires, which is 20–500 Hz in the noise calculation range, greatly affects how comfortable a motorist can drive. Consequently, the tire cavity noise simulation only takes into account first and second acoustic radiation modes and vibration modes of the tire. Table 5 displays the structural and acoustic radiation modal frequencies.
Structural and acoustic radiation modal frequencies.
The tire structure stiffness is small, but its internal cavity air density is larger. Therefore, the interaction between vibration and air will become more pronounced. The coupling modal frequencies of tire mode and cavity mode are shown in the third column of Table 5, which is obtained by computer simulation, according to the coupling acoustic theory. Because there are many modal frequencies of tire, only the modal frequencies which have great influence on tire noise are shown in the Table 5.
The higher order coupling modal must be solved in the sound pressure response calculation if the sound pressure response is to reflect additional acoustic modal features. Table 5 further demonstrates that the structural modal remains essentially constant at low order and that the acoustic-vibration coupling impact is not very evident. However, coupling’s effect on the structural modal increases with frequency, meaning that coupling’s effect on the distribution of sound pressure cannot be disregarded. When examining the noise of the elastic structure, it is important to take into account the coupling effect between the acoustic field and the structure, particularly in cases when the structure’s modal frequency is near to that of the cavity.
3.2 Tire cavity noise simulation and result analysis
The tire acoustic simulations are conducted. First, the acoustic simulation environment is updated with the tire rolling simulation results. Then, the tire radial excitation force is defined. The acoustic field point grid is established. And the acoustic grid as seen in Figure 5 is introduced. Configure the field point grid at the tire longitudinal interface to measure 1000 × 1000 mm with a grid spacing of 10 mm. Air with a density of 1.225 kg/m3 and a sound velocity of 340 m/s is referred to as the cavity grid. By transferring data using the Fourier transform, the grid surface’s acoustic response is computed.
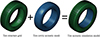 |
Figure 5 Tire acoustic simulation model. |
The coupled acoustic-vibration model of the tire cavity can be used to determine the tire cavity noise based on the radial tire force input. Figure 6 illustrates the extraction of the sound pressure distribution in the tire cavity at the peak frequency of 205 Hz. The diagram illustrates that the sound pressure level (SPL) on the left and right sides of the tire is relatively low, while the higher SPL is observed at the top of the tire cavity and ground position. The results concur with those of Wand and Wu [19] and Yi et al. [24].
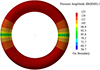 |
Figure 6 Cavity pressure distribution at 205 Hz. |
In order to better evaluate tire cavity noise, this paper selects four field points in tire cavity as sound pressure observation points, with specific locations as shown in Figure 7. The SPL curve is calculated as an average of the four field points in tire cavity, as shown in Figure 8.
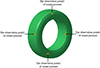 |
Figure 7 Sound pressure observation points at four locations. |
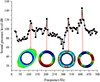 |
Figure 8 Tire acoustic simulation result. |
The SPL has peak value at 110 Hz, 205 Hz, 330 Hz and 410 Hz. The frequency of 110 Hz corresponds to the second vibration mode of tire. The frequency of 205 Hz corresponds to the first cavity mode of tire. The frequency of 330 Hz corresponds to the higher-order vibration mode of the tire, mainly in the side of the tire. The frequency 410 Hz corresponds to the second-order cavity mode of the tire.
The spectral characteristics shown in Figure 8 can clearly demonstrate the properties of tire cavity noise at different frequencies. However, in order to investigate the impact of parameter variations of sound-absorbing material on tire cavity noise and evaluate the merits of different noise reduction schemes, a definitive evaluation parameter is required. This paper proposes to use the A-weighted SPL as the evaluation metric. The overall A-weighted SPL can be obtained as following formula:
![Mathematical equation: $$ {L}_{\mathrm{Ave}}=10\times {lg}\enspace \left[\sum_{i=1}^N (1{0}^{\frac{{L}_{{Ai}}-{V}_i}{10}})\right]. $$](/articles/aacus/full_html/2025/01/aacus240033/aacus240033-eq2.gif) (2)
(2)
Here LAi represents the SPL in the ith one-third octave band within the frequency range of 20–500 Hz. Vi represents the corresponding A-weighted correction values, which can be obtained by referring to international standard IEC 61672-1:2013. N is the number of one-third octave bands. The A-weighted SPL of the tire cavity is 140.5 dB (A) by taking the field point grid of the lower part of the tire as the observation point.
4 Reduction of tire cavity noise
4.1 Introduction of sound-absorbing material
The primary parameter of the sound-absorbing material required for tire cavity noise reduction should be used as the reference value. And a control group is established for a subsequent investigation. As a result, the sound-absorbing material chosen has a thickness of 10 mm, as indicated in Table 6 of the rubber foam material parameters. The rubber foam and tire were filled with a 2 mm damping layer to provide a multi-layer composite property.
Properties of sound-absorbing materials.
The position of the built-in sound-absorbing material in the tire is shown in Figure 9. The inside side of the tire grounding parts cavity is the observation point of sound pressure. The reason is that this paper mainly studies the relationship between cavity resonance and noise. Therefore, it is more convenient to observe the relationship between the two when the observation point is chosen in the cavity. The inside side of the tread is covered with sound-absorbing material, and the sound pressure value recorded in tread position is the result of the sound pressure measurement made at the observation point. The inside surface of the tire sidewall was coated with sound-absorbing material, and the sound pressure recorded in side position. The adhesive area of the sound-absorbing material is set to equal area, meaning that the total area of the two sides of the sound-absorbing equals that of the middle, in order to control the variables to compare the noise.
 |
Figure 9 Paste position of sound-absorbing material. (a) In the middle of the tire; (b) Both sides of the tire. |
The Johnson-Champoux-Allard model (JCA model) is used in the simulation process, which is one of the effective medium theoretical models to describe the acoustic behavior of porous acoustic material. The equivalent density and volume elastic modulus of the model are specified as follows [25]:
 (3)
(3)
![Mathematical equation: $$ {Ke}=\gamma {P}_0\frac{1}{\gamma -(\gamma -1){\left[1-\frac{8{jw}\sqrt{1+\frac{j{P}_r{p}_0w{\mathrm{\Lambda }}_1^2}{16\eta }}}{{P}_r{p}_0w{\mathrm{\Lambda }}_1^2}\right]}^{-1}}. $$](/articles/aacus/full_html/2025/01/aacus240033/aacus240033-eq4.gif) (4)
(4)
Here a0 is tortuosity, p0 is the density of air, δ is the flow resistivity, ε is porosity, w is the acoustic angular frequency, η denotes the air dynamic viscosity, γ is the insulation coefficient of air, P0 is the atmospheric pressure, P0 = 101320 Pa, Pr is the air Planck constant, Λ1 is the thermal characteristic length, Λ is the viscous characteristic length.
The JCA model considers the influence of microscopic factors such as viscous and thermal conduction effects on acoustic properties, and introduces five characteristic parameters to describe the material properties, such as flow resistance, porosity, tortuosity, viscous characteristic length, and thermal characteristic length. Among them, the most important parameters are porosity and flow resistance, where porosity represents the ratio of the volume of saturated fluid (generally air) in a porous material to the total volume of the material; flow resistance is defined as the resistance of air flowing through a unit thickness of porous material. The tortuosity is a structural dimensionless parameter, also known as the structural shape factor, that depends only on the geometry of the porous material. The viscous characteristic length and the thermal characteristic length apply to higher frequencies and have little effect at lower frequencies. Therefore, these three parameters can be expressed as constants in the study. Density can reflect the weight of the porous material per unit volume, and thickness reflects the physical dimensional properties of the porous material, and these two parameters directly affect the propagation speed and attenuation characteristics of sound waves in the material.
Therefore, the discussion should focus on the effect of different parameter values of porosity, flow resistance, density and thickness on the A-weighted SPL.
4.2 Effect of density of porous sound-absorbing material
Densities of commonly used sound-absorbing material range from 30 to 100 kg/m3. The density of the substance used to absorb sound increases its cost. The tread position and side position of the tire were covered with porous sound-absorbing material. In addition, Figure 10 gives the A-weighted SPL of tire cavity noise when the density of the porous sound-absorbing varies.
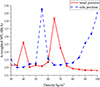 |
Figure 10 A-weighted SPL of the tire cavity varying with different material densities when the porous sound-absorbing material is located at different sticking positions. |
It can be inferred from Figure 10 that when the sound-absorbing material are placed on side position, the minimum tire sound pressure is 122.0 dB and the density is 35 kg/m3. But observing the curve of side position in Figure 10, the minimum value can not represent the best noise reduction scheme under the influence of density. It ranges from 35 to 50 kg/m3 and 65 to 80 kg/m3 which also have relatively low A-weighted SPL. In the same way, a range of 45–55 kg/m3 and 75–100 kg/m3 are the best noise reduction scheme for the tread position. For applying sound-absorbing materials to the side position, high-density soundproofing reduces the ability of sound waves to be reflected in space. As the density of the material increases, the internal pores may become smaller or tighter. The ability of the material layer to absorb sound is reduced by excessive density, which obstructs the passage of sound waves into the inner layer. On the other hand, if the density of the material is reduced, the internal pores may become more loose and open. In this case, the energy loss of sound wave transmission is small, resulting in less effective sound absorption. Therefore, there is an optimal density for porous sound-absorbing materials. At this density, the material can balance the transmission rate of sound waves to achieve the best sound absorption effect.
4.3 Effect of flow resistance of porous sound-absorbing material
Physically speaking, flow resistance is inversely related to fluid velocity and material thickness and directly proportional to the difference in sound pressure. The fluid velocity and material thickness were held constant throughout the investigation, whereas the acoustic pressure difference fluctuated. Flow resistances of sound-absorbing materials commonly used are between 5000 and 20000 Pa·s/m2. The tire’s tread and side are coated with the porous sound-absorbing material. Furthermore, Figure 11 illustrates the variation of tire cavity noise with the flow resistance of the porous sound-absorbing material.
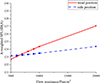 |
Figure 11 A-weighted SPL of the tire cavity varying with different flow resistances when the porous sound-absorbing material is located at different sticking positions. |
The porous sound-absorbing material with varying flow resistances have a positive correlation with A-weighted SPL, as inferred from Figure 11. The sound pressure differential increases with increasing flow resistance. The sound pressure difference is calculated by subtracting the sound pressure at the source less the sound pressure across the from that in the porous medium. The observed noise increases with flow resistance when the sound pressure at the source remains constant. Therefore, the tire’s ability to reduce noise gets worse as flow resistance rises. Furthermore, the inner side of the tread contains sound-absorbing material that reduces noise better than the side position when the sound pressure is lower. Consequently, when the sound-absorbing material is pasted on the tire’s tread and side position, a flow resistance of 5000 Pa·s/m2 can be chosen.
4.4 Effect of porosity of porous sound-absorbing material
The volume of pores divided by the volume of the porous substance is known as porosity. Porosity of sound-absorbing material commonly used is between 0.55 and 0.95. The tire’s side and tread position are coated with porous material that absorbs sound. Furthermore, Figure 12 gives the A-weighted SPL of tire cavity noise when the porosity of the sound-absorbing material varies.
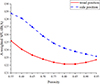 |
Figure 12 A-weighted SPL of the tire cavity varying with different material porosities when the porous sound-absorbing material is located at different sticking positions. |
It can be inferred based on Figure 12 that the A-weighted SPL in the tire cavity and various porosity porous sound-absorbing materials are negatively correlated at the side position. When the porosity is 0.85, A-weighted SPL has a minimum value at the tread position. The amount of acoustic energy that is converted into other energy increases with increasing pore number ratio. And these other energies refer to thermal energy, the energy of mechanical vibration of the sound-absorbing material, and the small particles or fibers inside the sound-absorbing material that undergo tiny movements (dynamic energy). Consequently, the tire cavity noise reduction effect improves as porosity increases. However, when the porosity increases to a certain value, the porosity will be too large and the consumption capacity will decrease, so there is an optimal value. When applied to the tread position of tires, sound-absorbing material with a porosity of 0.85 can be utilized to minimize noise; when applied to the side position of tires, sound-absorbing material with a porosity of 0.95 can be utilized to minimize noise.
4.5 Effect of thickness of porous sound-absorbing material
The tire’s side and tread position, respectively, are covered with porous sound-absorbing material. Figure 13 illustrates the variation of tire cavity noise with the thickness of the porous sound-absorbing material.
 |
Figure 13 A-weighted SPL of the tire cavity varying with different material thicknesses when the porous sound-absorbing material is located at different sticking positions. |
Figure 13 shows the relationship between the sound pressure of tire cavity noise and the thickness of the porous sound-absorbing material. When the thickness of the sound-absorbing material is less than 30 mm, the A-weighted SPL is higher; furthermore, when the thickness exceeds 30 mm, the sound-absorbing material on the inside of the sidewall of the tire exhibits a stronger noise-reducing effect than that of the sound-absorbing material on the tread. It is worth noting that the noise reduction effect at these two locations is also evident beyond 80 mm. In practice, however, the thickness of the sound-absorbing material should be selected according to the actual tire tread and side space, and the thicker the layer of the sound-absorbing material will result in an increase in the overall volume of the tire.
Analysis of Figure 10–13 shows that thickness and density of the sound-absorbing material have a more significant effect on tire cavity noise than the porosity and flow resistance. Therefore, the density and thickness of the sound-absorbing material should be paid more attention to if the noise reduction effect is to be obvious.
4.6 Effect of density and thickness interactions of porous sound-absorbing material
From Sections 4.2–4.5, it is clear that the most influential parameters on porous sound-absorbing material are thickness and density. Consequently, a more exhaustive grid search is performed for both parameters, thickness and density, to investigate the effect of interaction. Figure 14 gives the A-weighted SPL of tire cavity noise when the thickness of the porous sound-absorbing material is 10–100 mm, corresponding to a density of 30–100 kg/m3.
 |
Figure 14 A-weighted SPL of the tire cavity varying with different material densities and thicknesses when the porous sound-absorbing material is pasted at different sticking positions. (a) Sound-absorbing material pasted on the side position; (b) Sound-absorbing material pasted on the tread position. |
Figures 14a and 14b present the data graphs of A-weighted SPL of tire cavity noise when sound-absorbing material is pasted on the side and tread positions, respectively. These simulations have investigated the variation of A-weighted SPL by combining different thicknesses and densities. As can be seen from Figure 14, the A-weighted SPL shows a clear trend over a wide range of densities and thicknesses. In general, increasing both thickness and density can effectively reduce the A-weighted SPL, but it is not a linear relationship and there are some fluctuations and peaks. The more pronounced peaks and valleys areas are associated with specific combinations of density and thickness, indicating that the sound pressure values can be minimized with a combination of these parameter values.
In Figure 14a, the A-weighted SPL reaches its lowest value, roughly 106.0 dB, when both density and thickness are at their maximum values; when the thickness is a maximum of 100 mm and the density is varied, the observed A-weighted SPL values fall within a range of 106.0–110.2 dB, which is relatively lower compared to other conditions The A-weighted SPL is relatively low in the range of approximately 107.3–113.7 dB for densities of 30–50 kg/m3 and thicknesses of 75–95 mm, and in the range of 55–100 kg/m3 and thicknesses of 80–95 mm. From Figure 14b, it is observed that the A-weighted SPL is lowest at about 107.9 dB when the density and thickness is at their maximum values; the A-weighted SPL is lower for thicknesses of 95–100 mm and densities of 60–70 kg/m3, thicknesses of 90–100 mm and densities of 75–80 kg/m3, and thicknesses of 85–100 mm and densities of 85–100 kg/m3, and ranges from approximately 107.9–111.9 dB.
This suggests that there is an interaction between the acoustic impedance properties and the thickness and density of sound-absorbing material. Increasing the thickness may enhance the energy absorption, while increasing the density appropriately may improve the acoustic wave propagation characteristics. By combining these two parameters, the noise control performance of tires can be significantly improved. In summary, when the material thickness is relatively thin, the tread position for pasting sound-absorbing material offers better sound absorption performance than the side position. When the material thickness is thicker, the side position is the more effective choice for achieving optimal sound absorption. However, in real practice, the thicker the layer of the sound-absorbing material applied to the tire, the greater the increase in overall volume of the tire will be. Therefore, a certain thickness of sound-absorbing material should be selected according to the actual situation.
5 Optimal noise reduction scheme
5.1 Comparison of two position schemes
Based on the discussion in the Section 4, the optimal noise reduction schemes of the two positions are compared. To obtain Figure 15, we subtract the A-weighted SPL shown in Figure 14 from the A-weighted SPL before noise reduction, which is 140.5 dB (A). Figure 15 illustrates the difference in A-weighted SPL before and after applying the sound-absorbing material to the interior of the tire.
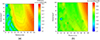 |
Figure 15 Difference in A-weighted SPL of tire cavity noise before and after applying sound-absorbing material. (a) Sound-absorbing material pasted on the side position; (b) Sound-absorbing material pasted on the tread position. |
The results shown in Figure 15 are consistent with those presented in Figure 14, indicating that the optimal noise reduction occurs when the sound-absorbing material is applied to the side of the tire at its maximum thickness, regardless of the density. Specifically, the A-weighted SPL is reduced by up to 34.5 dB (A), compared with that before the application of sound-absorbing material. When the sound-absorbing material is pasted on the tread of the tire at its maximum thickness and a higher density, a more significant noise reduction effect is observed. Specifically, the A-weighted SPL is reduced by up to 32.7 dB (A), compared with that before the application of sound-absorbing material.
Then, an investigation into the uncertainty of the reduced A-weighted SPL is carried out. First, a certain range of parameter values for density and thickness is selected. In order to reduce the overall volume and mass, thickness values of 70 mm or more are not considered. The thickness range of Figure 15a is selected to be 40–65 mm, corresponding to a density range of 35–55 kg/m3; the thickness range of Figure 15b is selected to be 10–55 mm, corresponding to a density range of 30–55 kg/m3; and the thickness range of Figure 15b is selected to be 10–65 mm, corresponding to a density of 65–100 kg/m3, and the three sets of the above ranges of values selected are called respectively “Group A”, “Group B” and “Group C”. Next, the mean, variance, maximum and minimum values of the range values of each group were calculated, as shown in Table 7.
Reliability of three different sets of data.
The mean value reflects the average of the data in each group and the variance reflects the degree of stability of the data. As can be seen from Table 7:
Overall performance: Group A has the best overall noise reduction (highest mean value), but also has the largest interclass variation (largest variance).
Stability: Although the overall noise reduction effect of Groups B and C is not as good as that of Group A, their interclass differences are smaller (smaller variance), indicating that the data points within these groups are more stable.
Data distribution: The analysis of the maximum and minimum values provides further insight into the distribution of the data in each group. Group A has the widest distribution of data; while Group B and C are more concentrated.
In summary, Group A exhibits the highest uncertainty, while Group B and C have relatively low uncertainty and their data points are more concentrated and stable. However, the mean value of the data in Group A is larger than that of Group B and C. The minimum values of these three groups do not differ much, so the data in Group A have a better noise reduction effect.
The data generated for A-weighted SPL do not accurately represent actual experimental data and are subject to uncertainties, and the following are some common reasons for this:
Model simplification error: In simulation, tires are simplified to a certain extent in order to simplify calculations and improve computational efficiency, but these simplifications lead to errors as the model fails to capture all the important physical features of the actual system.
Uncertainty in material parameters: Simulations are usually idealized assumptions, and actual materials may be subject to manufacturing errors, thermal expansion and contraction, resulting in acoustic properties that are inconsistent with simulation assumptions.
Numerical computation errors: The grid in the simulation affects the accuracy of the results; too large a grid may lead to numerical errors, while too small a grid increases the computational burden and may affect the efficiency of the simulation and the stability of the results.
Porous acoustic materials error: In simulation, porous materials usually use the impedance model that comes with the software, which is able to achieve good coupling effect with tires. However, in the actual experimental process, the porous material may be poorly or excessively pasted, resulting in its inability to give full play to the expected effect, and it is difficult to achieve perfect acoustic absorption performance.
In summary, simulation does not fully express the real situation and complexity of the experiment, and simulation can only present the trend and effect of the real situation. Therefore, in practical applications, it is necessary to ensure an accurate understanding of the simulation and minimize the influence of uncertainty factors to improve the reliability of the results.
Next, a set of optimal values from two different noise reduction schemes is selected for the study. In order to reduce the overall volume and mass, the thickness of 70 mm or more is not considered, and only the A-weighted SPL corresponding to thicknesses of 10–65 mm and any density are compared, and the parameter with the smallest A-weighted SPL is selected. The scheme parameters are shown in Table 8 and the SPL results are shown in Figure 16.
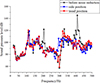 |
Figure 16 Comparison of two schemes. |
Properties of the final scheme.
It can be inferred from Figure 16 that compared with the SPL before noise reduction, at 110 Hz and 330 Hz, the SPL decreased a little; while at 205 Hz and 410 Hz, the SPL drops obviously. According to the conclusion of Section 3, the frequency of 205 Hz corresponds to the first cavity mode of the tire; the frequency of 410 Hz corresponds to the second cavity mode of the tire. It shows that the sound-absorbing material, which is pasted on the inner side of the tire, has a remarkable effect on reducing the cavity resonance noise of the tire.
To compare the noise reduction effects of the two positions, their A-weighted SPLs were calculated according to Formula (2), as shown in Table 9.
A-weighted SPL of two schemes.
Table 9 shows that A-weighted SPL decreased by 24.8 dB using tread position noise reduction scheme. While with the side position noise reduction scheme, the A-weighted SPL is reduced by 27.7 dB compared with the tire without sound-absorbing material. The noise reduction effect of side position is 2.9 dB better than that of tread position.
5.2 The selection of noise reduction scheme
For the overall trend of A-weighted SPL, the side position is superior to the tread position in the frequency range before 290 Hz; however, the tread position is superior to the side position in the frequency range of 290–320 Hz; and the side position is superior to the tread position in the frequency range after 320 Hz. Researchers can choose the best noise reduction program according to their different needs.
A-weighted SPL is the main index of noise evaluation by ISO and most countries, and it can reflect the subjective evaluation of noise more accurately. As a result, A-weighted SPL is selected as the final evaluation criterion in this study. Considering the effect of different sound absorbing materials at different positions and different sound-absorbing characteristics on tire cavity noise, the optimal noise reduction scheme is selected for 215/55R17 tire. That is, sound absorption on side position, density of 55 kg/m3, porosity of 0.95, flow resistance of 5000 Pa·s/m2, thickness of 40 mm.
6 Conclusion
This study employs built-in sound-absorbing material to reduce tire cavity noise in light of the noticeable noise produced by tires of electric vehicles at high speeds. First, the tire modal test is used to validate the finite element model. Then, the finite element method is used to analyze the rolling of the tires, and the tire radial force data is obtained to serve as the acoustic simulation’s boundary condition. After that, the sound pressure is obtained by analyzing the tire cavity noise.
This study examines the impact of varying sound-absorbing material density, porosity, flow resistance, and thickness on tire cavity noise. Tire cavity noise is negatively correlated with porosity of sound-absorbing material. There is a positive association between tire cavity noise and the flow resistance of sound-absorbing material. To achieve the greatest amount of noise reduction, the sound-absorbing material can be applied at the side position. This leads to the choice of the sound-absorbing material with density of 55 kg/m3, porosity of 0.95, flow resistance of 5000 Pa·s/m2, thickness of 40 mm. The A-weighted SPL is reduced by 27.7 dB compared with the tire without sound-absorbing material.
Given the experimental conditions, it is not possible for this paper to validate the proposed noise reduction scheme under real driving conditions since the focus of this paper is on tire cavity noise. However, we have conducted experiments on tire drop noise, which can prove that sound-absorbing materials do have a certain effect on drop noise reduction. Considering that the drop noise is not exactly the same as the tire cavity noise, the noise reduction effect of acoustic materials on the cavity noise cannot be directly proved, so the experimental results of the drop noise were not put into the paper. Moreover, this paper focuses on the sound absorption performance of sound-absorbing materials and does not analyze the mechanical durability and environmental risks. However, the Chinese standard T/ZZB 1740 – 2020 has put forward detailed requirements for the durability, heat resistance and mildew resistance of sound-absorbing materials. It can be seen from this that there are certain standards for sound-absorbing materials during the manufacturing and research and development process. The sound-absorbing materials produced by manufacturers in our country have a certain degree of durability and pose no environmental risks.
In this study, the noise reduction patterns of acoustic materials when pasted on the inside of tires at different locations are investigated. Through research and innovation, quieter tire materials and designs can be developed to effectively reduce tire noise under long-term conditions. Effectiveness tests under real-world conditions are needed in subsequent studies to evaluate the actual effects of noise reduction measures and to adjust and improve them accordingly. The effectiveness of the application and optimization of sound-absorbing materials can also be further explored in depth in subsequent studies by combining factors such as the radiated sound field of tires. The effects studied were limited to the tire cavity and the impact on the emitted acoustic energy was not evaluated. In future research work, we will further investigate the effect on the emitted acoustic energy.
Therefore, this study has a certain guiding significance and promotion value in terms of implementation and effectiveness in long-term and real-world conditions, and through in-depth research and practice, effective methods can be found to reduce tire noise, thereby improving the urban environment and enhancing the quality of life of residents.
Funding
This study is funded by the National Natural Science Foundation of China (Grant No. 51805241; 51605215; 52372357), the Open Fund for State Key Laboratory of Automotive Simulation and Control (Grant No. 20210205), Nanjing Institute of Technology Innovation Foundation (Grant No. CKJB202206) and Postgraduate Science & Technology Innovation Program of Nanjing Institute of Technology (Grant No. TB202417031).
Conflicts of interest
No potential conflict of interest was reported by the authors.
Data availability statement
The research data associated with this article are included within the article.
Appendix A
The sound-absorbing material employed in the simulation of tire cavity noise is presented in Figure A1.
 |
Figure A1 The sound-absorbing material. |
References
- C. Hou, H. Shao, T. Zheng: The new energy automobile industry development plan has been made, the tire tread material faces the new challenge. Rubber Technology 18 (2020) 369–375. [Google Scholar]
- J. Zeng, Y. Que, S. Cai: Development status and design ideas of electric vehicle tire. Rubber Industry 66 (2019) 883–894. [Google Scholar]
- R. Wehr, A. Fuchs, S. Breuss: Statistical tyre/road noise modelling based on continuous 3D texture data. Acta Acustica 5 (2021) 52. [CrossRef] [EDP Sciences] [Google Scholar]
- J. Pinay, Y. Saito, C. Mignot, F. Gauterin: Understanding the contribution of groove resonance to tire road noise on different surfaces under various operating conditions. Acta Acustica 4 (2020) 6. [CrossRef] [EDP Sciences] [Google Scholar]
- K. Seki, S. Shin, T. Tabaru: Analysis of wavelet correlation between tyre sounds and tread patterns, in: 2005 IEEE Networking, Tucson, AZ, USA, 19–22 March, 2005, pp. 241–246. [Google Scholar]
- X. Hu, X. Liu, Y. Shan, T. He: Simulation and experimental validation of sound field in a rotating tire cavity arising from acoustic cavity resonance. Applied Sciences 11 (2021) 1121. [CrossRef] [Google Scholar]
- W. Zhao, Y. Liu, X. Liu, Y. Shan, X. Hu: Analysis of tire acoustic cavity resonance energy transmission characteristics in wheels based on power flow method. Applied Acoustics 11 (2021) 3979. [Google Scholar]
- Y. Kamiyama: Development of a new on-wheel resonator for tire cavity noise. SAE Paper 01 (2014) 0022. [Google Scholar]
- S. Kim, K. Sung, D. Lee, S. Huh: Cavity noise sensitivity analysis of tire contour design factors and application of contour optimization methodology. Journal of Central South University 19 (2012) 2386–2393. [CrossRef] [Google Scholar]
- G. Wang, L. Qiao, H. Zhou: Influence of PCR tire grounding characteristics to noise and rolling resistance. Journal of Mechanical Engineering 55 (2019) 123–131. [Google Scholar]
- X. Hu, X. Liu, Y. Shan, T. He: Simulation and experimental validation of sound field in a rotating tire cavity arising from acoustic cavity resonance. Applied Sciences 11 (2021) 1121. [CrossRef] [Google Scholar]
- Y. Liu, X. Liu, Y. Shan, X. Hu, J. Yi: Research on mechanism and evolution features of frequency split phenomenon of tire acoustic cavity resonance. Journal of Vibration and Control 27 (2021) 343–355. [CrossRef] [Google Scholar]
- B. Simone, C. Roberto, A. Mats, C. Paola, P. Anna: Modelling of a lined tyre for predicting cavity noise mitigation. Applied Acoustics 5 (2019) 033. [Google Scholar]
- H. Hyeonu, S. Mathew, J. Jaehyung, N. Arup: Acoustic metasurface-aided broadband noise reduction in automobile induced by tire-pavement interaction. Materials 14 (2021) 4262. [CrossRef] [PubMed] [Google Scholar]
- Z. Mohamed, X. Wang: A study of tyre cavity resonance and noise reduction using inner trim. Mechanical Systems and Signal Processing 50 (2015) 498–509. [CrossRef] [Google Scholar]
- B. Simone, M. Abom: Tyre cavity noise: porous materials as a countermeasure. Inter-Noise and Noise-Con Congress and Conference Proceedings. Institute of Noise Control Engineering 253 (2016) 6730–6735. [Google Scholar]
- H. Zhou, H. Li, Q. Xia: Study on the resonant noise reduction mechanism of porous materials for tire cavity. Journal of Vibration Engineering 35 (2022) 1147–1156. [Google Scholar]
- Y. Yang, Y. Wei: Experimental study on noise reduction of tire with sound-absorbing material, in: China Mechanics Congress-2017 and Proceedings Celebrating the 60th anniversary of the China Society of Mechanics, Beijing, China, 13 August, 2017, p. 15. [Google Scholar]
- G. Wang, L. Wu: Effect of properties of melamine porous sound-absorbing material on resonance noise of tire cavity. Rubber Industry 81 (2020) 356–371. [Google Scholar]
- L. Zang, T. Lv, Y. Li, X. Wang: Topology optimization of inserts structure of run-flat tire under zero-pressure driving condition. International Journal of Automotive Technology 24 (2023) 311–321. [CrossRef] [Google Scholar]
- T. Lv, L. Zang, C. Xue, Y. Li, Y. Mao, X. Wang: Study on the effect of different design parameters of sidewall insert rubber on the mechanical characteristics of self-supporting run-flat tires. Lubricants 11 (2023) 458. [CrossRef] [Google Scholar]
- W. Xu, H. Zeng, P. Yang, M. Zang: Numerical analysis on tractive performance of off-road tire on gravel road using a calibrated finite element method-discrete element method model and experimental validation. Journal of Automobile Engineering 234 (2020) 3440–3457. [CrossRef] [Google Scholar]
- C. Lecomte, W. Graham, M. Dale: A shell model for tyre belt vibrations. Journal of Sound and Vibration 10 (2010) 1717–1742. [CrossRef] [Google Scholar]
- J. Yi, X. Liu, Y. Shan: Characteristics of sound pressure in the tire cavity arising from acoustic cavity resonance excited by road roughness. Applied Acoustics 146 (2019) 218–226. [CrossRef] [Google Scholar]
- D. Abdi, M. Monazzam, E. Taban, A. Putra, F. Golbabaei, M. Khadem: Sound absorption performance of natural fiber composite from chrome shave and coffee silver skin. Applied Acoustics 182 (2021) 108264. [CrossRef] [Google Scholar]
Cite this article as: Shi T. Zhou P. Feng Y. Lv T. Li Y, et al. 2025. Simulation study on noise reduction of electric vehicle tire with built-in sound-absorbing material. Acta Acustica, 9, 11. https://doi.org/10.1051/aacus/2024081.
All Tables
All Figures
|
Figure 1 Sound generation mechanism of tire vibration noise. |
| In the text | |
|
Figure 2 Tire finite element model. (a) Tire section model; (b) Rolling simulation model. |
| In the text | |
|
Figure 3 Tire modal test environment. |
| In the text | |
|
Figure 4 Radial force at tire ground position. (a) Radial force of tire ground position in time domain; (b) Radial force of tire ground position in frequency domain. |
| In the text | |
|
Figure 5 Tire acoustic simulation model. |
| In the text | |
|
Figure 6 Cavity pressure distribution at 205 Hz. |
| In the text | |
|
Figure 7 Sound pressure observation points at four locations. |
| In the text | |
|
Figure 8 Tire acoustic simulation result. |
| In the text | |
|
Figure 9 Paste position of sound-absorbing material. (a) In the middle of the tire; (b) Both sides of the tire. |
| In the text | |
|
Figure 10 A-weighted SPL of the tire cavity varying with different material densities when the porous sound-absorbing material is located at different sticking positions. |
| In the text | |
|
Figure 11 A-weighted SPL of the tire cavity varying with different flow resistances when the porous sound-absorbing material is located at different sticking positions. |
| In the text | |
|
Figure 12 A-weighted SPL of the tire cavity varying with different material porosities when the porous sound-absorbing material is located at different sticking positions. |
| In the text | |
|
Figure 13 A-weighted SPL of the tire cavity varying with different material thicknesses when the porous sound-absorbing material is located at different sticking positions. |
| In the text | |
|
Figure 14 A-weighted SPL of the tire cavity varying with different material densities and thicknesses when the porous sound-absorbing material is pasted at different sticking positions. (a) Sound-absorbing material pasted on the side position; (b) Sound-absorbing material pasted on the tread position. |
| In the text | |
|
Figure 15 Difference in A-weighted SPL of tire cavity noise before and after applying sound-absorbing material. (a) Sound-absorbing material pasted on the side position; (b) Sound-absorbing material pasted on the tread position. |
| In the text | |
|
Figure 16 Comparison of two schemes. |
| In the text | |
|
Figure A1 The sound-absorbing material. |
| In the text | |
Current usage metrics show cumulative count of Article Views (full-text article views including HTML views, PDF and ePub downloads, according to the available data) and Abstracts Views on Vision4Press platform.
Data correspond to usage on the plateform after 2015. The current usage metrics is available 48-96 hours after online publication and is updated daily on week days.
Initial download of the metrics may take a while.