| Issue |
Acta Acust.
Volume 10, 2026
|
|
|---|---|---|
| Article Number | 35 | |
| Number of page(s) | 13 | |
| Section | Acoustic Materials and Metamaterials | |
| DOI | https://doi.org/10.1051/aacus/2026031 | |
| Published online | 19 May 2026 | |
Scientific Article
Investigating sound insulation performance of gradient airflow resistivity porous materials
1
School of Mechanical and Automotive Engineering, Shanghai University of Engineering Science, 333, Longteng Road, Shanghai 201620, PR China
2
Shanghai Zhenhua Heavy Industries Co., Ltd., No. 3261 Dongfang Road, Pudong New Area, Shanghai 200125, PR China
3
PROSYNX Technology Inc., 658, Jinzhong Road, Shanghai 200335, PR China
* Corresponding author: This email address is being protected from spambots. You need JavaScript enabled to view it.
Received:
9
July
2025
Accepted:
2
April
2026
Abstract
The sound insulation performance of porous materials with gradient airflow resistivity is investigated using a combined approach based on the Johnson–Champoux–Allard (JCA) model and the Virtual Transmission Loss (VTL) method. These materials, known for their tunable acoustic absorption properties, are evaluated through finite element simulations and Statistical Energy Analysis (SEA) to assess the influence of resistivity distribution and layer configuration. Results show that a low-to-high resistivity gradient structure provides improved sound insulation characteristics, particularly when implemented as a three-layer design. Compared to uniform and high-to-low configurations, the optimized gradient structure achieves a higher transmission loss (TL) across the 1000–8000 Hz frequency range. Application to automotive acoustic packages demonstrates its practical effectiveness, with an increase in TL of up to 5.8 dB for the roof assembly, corresponding to a 5.8 dB reduction in the receiver sound pressure level (SPL). In contrast, the effectiveness of the gradient design for the dash was negligible due to its more complex structural constraints. This study underscores the importance of gradient structures in porous materials, demonstrating that significant improvements in TL can be achieved by adjusting the airflow resistivity gradient and layer structure, particularly in automotive interior acoustics.
Key words: Gradient airflow resistivity porous material / Porous material / Gradient structure / Airflow resistivity / Sound package
© The Author(s), Published by EDP Sciences, 2026
 This is an Open Access article distributed under the terms of the Creative Commons Attribution License (https://creativecommons.org/licenses/by/4.0), which permits unrestricted use, distribution, and reproduction in any medium, provided the original work is properly cited.
1 Introduction
The automotive acoustic package comprises components engineered to improve vehicle NVH (Noise, Vibration, and Harshness) performance. These systems integrate acoustic absorption, sound insulation, vibration damping, and sealing elements, strategically positioned along noise transmission pathways from sources to the cabin, engine compartment, and trunk. This methodology is widely adopted for noise mitigation. Acoustic packages generally utilize multilayer material systems that enhance both sound absorption and insulation performance. Typical materials include polyurethane foam (PU), ethylene-vinyl acetate copolymer (EVA), and polyethylene terephthalate (PET). Recent research has focused on advancing the acoustic properties of these materials through structural and compositional optimization.
Research on automotive acoustic packages primarily addresses two key directions. The first involves holistic optimization of the acoustic package system, encompassing material thickness distribution and topological arrangement of components. Advances in material science have driven research toward balancing competing acoustic properties while minimizing additional weight [1–3]. Multi-objective optimization methods such as grey correlation analysis, particle swarm optimization, and genetic optimization algorithms are widely applied to parameters including material selection, thickness, and structural configuration. These optimizations typically target sound insulation and lightweight design, with experimental and numerical simulations validating enhanced acoustic performance through measurable reductions in cabin noise and overall system weight. Notably, Dong et al. [4] proposed a robust design methodology, though its applicability to real-world manufacturing constraints, such as material imperfections or production tolerances, requires further validation. Similarly, Zhang [5] focused on topological optimization of acoustic package distribution but did not address practical installation challenges like spatial limitations or component integration. Despite these limitations, both studies advance acoustic package optimization.
In contrast, studies [6, 7] developed a systematic framework for optimizing automotive composite porous materials by integrating the Biot-JCAL model with genetic optimization algorithms. A computational platform was further established to analyze parameter impacts on acoustic properties, delivering solutions that balance theoretical precision with engineering feasibility for automotive acoustic package design.
The sound insulation and absorption properties of acoustic package materials critically influence the overall sound insulation efficacy. Consequently, improving the acoustic performance of porous materials through filler modification, parameter optimization, and structural design, particularly gradient-based configurations, has emerged as a research priority [8–10]. Gradient structural designs are increasingly adopted due to their capacity to precisely adjust acoustic absorption and sound insulation properties [11] and enable versatile material combinations. These advantages have driven the application of gradient porous materials and acoustic metamaterials in automotive acoustics. For instance, Wang et al. [12] and Chen et al. [13] conducted experimental and theoretical investigations on gradient porosity materials, demonstrating acoustic absorption and sound insulation performance enhancements through controlled structural variations. Tong [14] enhanced the sound absorption of porous materials by introducing gradient variations in porosity and perforation diameter. These parameters were synergistically combined to fabricate dual-phase gradient porous materials, which shifted the sound absorption peak toward lower frequencies, increased peak absorption values, and improved mid-to-low frequency performance. These microstructural parameters, such as porosity and perforation diameter, are intrinsically linked to the material’s macroscopic transport properties, most notably the airflow resistivity. In practice, a gradient in airflow resistivity is achieved by creating a gradient in the material’s physical microstructure. Therefore, airflow resistivity can be considered a critical parameter that bridges the material’s microstructural design with its overall acoustic behavior. Studies in [11, 15] systematically examined gradient airflow resistivity materials and provided key insights. For example, Prasetiyo et al. [11] demonstrated that for two-layer woven fabrics, combining layers with non-identical airflow resistivity was crucial to improving the sound absorption bandwidth and overcoming the performance dips found in uniform multi-layer systems. Building on this, Cheng et al. [15] investigated PU foams and concluded that a gradient structure with airflow resistivity increasing from low to high along the direction of sound propagation, particularly following a logarithmic profile, significantly enhances broadband sound absorption. Boulvert et al. [16] designed a numerical optimisation process applicable to gradient porous materials, the scheme relates the acoustic properties to the geometry of the material by means of a nonlinear conjugate gradient algorithm to design the optimum continuous gradient. Calculations show that the first absorption peak can be shifted to lower frequencies or the absorption bandwidth can be enlarged in the gradient material as compared to the uniform material, and the conclusions are verified by sample experiments. Further advancing this concept, recent studies have explored the optimization of the gradient’s shape itself to achieve tailored acoustic performance. By employing triply periodic minimal surfaces, one study [17] demonstrated that the porosity distribution along the thickness can be mathematically controlled to maximize acoustic absorption within a specific target frequency range. This highlights a sophisticated design approach where the gradient profile is directly linked to the desired frequency-dependent behavior. Collectively, these studies confirm that gradient porous materials effectively regulate sound absorption characteristics and achieve higher absorption coefficients than uniform materials. However, integrating gradient structures into acoustic panels necessitates concurrent evaluation of their sound insulation properties to ensure comprehensive performance optimization.
To accurately predict and optimize the performance of such gradient structures, reliable modeling techniques are essential. The Johnson–Champoux–Allard (JCA) model is a cornerstone for this purpose. Its reliability has been validated in previous works. For instance, Reference [18] experimentally and numerically verified the sound absorption of acoustic cotton, demonstrating that the JCA model achieves high accuracy in predicting absorption coefficients. Furthermore, Reference [19] systematically evaluated the influence of boundary conditions on parameter measurement, improving the reliability of performance modeling. These studies provide a solid foundation for the analytical and numerical methods adopted in the present work.
The acoustic performance of automotive components is critical for vehicle NVH. A distinction must be made between the transmission loss (TL) of a material, which is a fundamental measure of its sound blocking capability, and the overall sound insulation of an entire system. The latter is more complex, depending not only on the inherent TL of the constituent materials but also on their arrangement, the geometry of the components, and their interaction with the internal acoustic environment, such as sound absorption within cavities. To address these limitations, this study employs numerical simulations to evaluate the effects of gradient airflow resistivity structures and layer configurations on the sound insulation performance of porous materials within automotive acoustic packages. Utilizing the JCA model and the Virtual Transmission Loss (VTL) method in VA One, the analysis quantifies the influence of airflow resistivity variations on PU material performance across both sound absorption and insulation domains. This enables the identification of optimal airflow resistivity gradient ranges for enhanced sound insulation.
Subsequently, diverse gradient material configurations are constructed, with insulation performance assessed through sound insulation level curves and sound pressure level (SPL) analyses in the receiver cavity. The optimal gradient structure and layer arrangement are determined based on these metrics. The selected gradient airflow resistivity scheme is then applied to redesign porous materials, progressively replacing conventional layers in the automotive roof and dash acoustic package. Finally, comparative simulations evaluate the sound insulation improvements across multiple acoustic package configurations, validating the efficacy of the proposed gradient design approach.
2 Gradient materials and sound absorption/insulation calculation models
As shown in Figure 1, the gradient structure is designed as a material with airflow resistivity that varies perpendicular to the direction of sound wave incidence. The color gradient from light to dark represents a transition from low to high airflow resistivity. The two configurations shown represent sound wave incidence from the low-resistivity side (low-to-high resistivity gradient) and the high-resistivity side (high-to-low resistivity gradient), respectively. When the sound wave is incident on the layer with low airflow resistivity, the acoustic impedance at the surface is better matched with that of air. This condition allows more sound energy to penetrate into the material for subsequent dissipation, rather than being reflected. Conversely, when the sound wave is incident from the high airflow resistivity layer, a significant acoustic impedance mismatch occurs at the surface. This mismatch causes a larger portion of the incident sound energy to be reflected from the material’s surface, resulting in less energy entering the material to be dissipated.
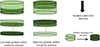 |
Figure 1. Schematic diagram of gradient airflow resistivity structure. |
To quantify the performance of these gradient structures, the sound insulation performance is evaluated using a VTL method, implemented via the Statistical Energy Analysis (SEA) framework in VA One. The primary performance metric is the TL, calculated as the decibel difference between the space-averaged SPL in the source acoustic cavity and a receiver acoustic cavity. The specific VTL model, shown in Figure 2, consists of a composite partition separating a source and a receiver cavity. Both cavities are modeled as air-filled enclosures. This partition is composed of a steel plate (0.8 mm thickness, 1 m2 area) lined with the porous materials of the acoustic package under investigation. Crucially, the acoustic package is arranged to face the source cavity. This specific arrangement means that the calculated TL encompasses not only the partition’s inherent sound blocking capability but also the significant effect of sound absorption within the source cavity, which reduces the reverberant sound field incident on the partition. Therefore, the reported TL in this study should be interpreted as a system-level TL that captures both insulation and absorption effects within the defined VTL setup.
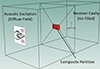 |
Figure 2. Schematic of the VTL model setup. |
The model is configured as follows: the volume of both the source and receiver cavities is set to 1000 m3, and a 1 Pa acoustic constraint (approximately 94 dB) is applied to the source cavity to simulate a diffuse sound field, which is a standard assumption for SEA in high frequency analysis. The damping loss factor for each cavity is defined as 1%; in the context of SEA, this parameter models the dissipation of acoustic energy within the air volume and at its boundaries, serving as a necessary input for the energy balance equation of the acoustic subsystem. The space-averaged SPL in the receiver cavity is the primary output used for the TL calculation.
It is important to note that the applied SEA and VTL models are based on linear acoustic theory. Consequently, the calculated results are independent of the absolute source amplitude; the 1 Pa constraint is utilized simply as a standard reference excitation. This linearity aligns with the physical definitions of the performance metrics, where TL is the logarithmic ratio of incident to transmitted acoustic power, and the sound absorption coefficient is the ratio of absorbed to incident acoustic power.
The simulation frequency range is set from 1000 Hz to 8000 Hz. While it is acknowledged that frequencies below 1000 Hz are important for automotive applications and that SEA predictions can be valid from approximately 400 Hz upward, this specific range was chosen for two primary reasons. First, this ensures the highest validity and robustness of the SEA predictions, as the method’s accuracy is greatest in frequency bands with high modal density, a condition well satisfied above 1000 Hz. Second, this study’s primary focus is to clearly investigate the specific effects of the airflow resistivity gradient, which are most pronounced and distinguishable in the mid to high frequency range. By focusing on this band, the fundamental performance differences between various gradient structures can be analyzed without the added complexities of the lower frequency vibroacoustic coupling that often dominates below 1000 Hz.
Furthermore, it is helpful to note a geometric characteristic of the VTL setup utilized in this study. The test partition has a surface area of 1 m2, which constitutes a small fraction of the total boundary area of the 1000 m3 cavities. Therefore, while the material’s acoustic absorption inherently dissipates the reverberant sound field, its quantitative effect on the space-averaged SPL within such a large cavity is relatively modest. This partition to cavity ratio explains why the decibel variations observed among different gradient structures appear numerically small. Nevertheless, this standardized, component-level configuration remains effective for isolating variables and comparatively ranking the acoustic performance trends of various gradient structures. It is anticipated that in full scale vehicle applications, where acoustic treatments encompass a larger proportion of the structural boundaries, these overall acoustic improvements will become more pronounced.
The intrinsic acoustic behavior of the porous materials is described by the Johnson–Champoux–Allard (JCA) model. Based on Biot’s theory [20], the JCA model is a widely used semi-phenomenological model that characterizes the acoustic properties of porous materials. Its formulation relies on five key physical parameters that describe the material’s internal microstructure: porosity (φ), airflow resistivity (σ), tortuosity (α∞), and the viscous (Λ) and thermal (Λ′) characteristic lengths. The modeling process proceeds in several steps. First, the model calculates the material’s effective properties–the equivalent density (ρeq) and the equivalent bulk modulus (Keq)–based on the five microstructural parameters, as shown in equations (1) and (2):
![Mathematical equation: $$ \begin{aligned} {\rho }_{\mathrm{eq} }&=\frac{{\alpha }_{\infty }{\rho }_0}{\phi }\left[1+\frac{\sigma \phi }{j\omega {\alpha }_{\infty }{\rho }_0}\sqrt{1+j\frac{4{\alpha }^2_{\infty }{\rho }_0\eta \omega }{{\sigma }^2\mathrm{\Lambda }^2{\phi }^2}}\right] \end{aligned} $$](/articles/aacus/full_html/2026/01/aacus250091/aacus250091-eq1.gif) (1)
(1)
![Mathematical equation: $$ \begin{aligned} K_{\mathrm{eq} }&=\frac{\gamma P_0}{\phi }{\left[\gamma -\frac{\gamma -1}{1-\frac{8j\eta }\mathrm{\Lambda ^{\prime 2}P_r\rho _0\omega }\sqrt{1+j\frac\mathrm{\Lambda ^{\prime 2}P_r\rho _0\omega }{16\eta }}}\right]}^{-1} \end{aligned} $$](/articles/aacus/full_html/2026/01/aacus250091/aacus250091-eq2.gif) (2)
(2)
Next, these effective properties are used to determine the material’s characteristic acoustic impedance (Zc) and its complex wave number (kc), as shown in equations (3) and (4):
 (3)
(3)
 (4)
(4)
Finally, from the characteristic impedance and wave number, the normal incidence sound absorption coefficient (α) of a uniform porous slab of thickness d can be calculated using equations (5) and (6).
 (5)
(5)
 (6)
(6)
Where: d is the thickness of the sample; Z s is the surface impedance of the material.
The symbols used throughout this model and their definitions are summarized in Table 1.
Each symbol and its meaning.
Before proceeding to the simulation, the fundamental assumptions underlying the selected theoretical framework must be clarified. It should be noted that the porous materials in this study are modeled as equivalent fluids using the JCA model. While the comprehensive Biot-JCA model accounts for elastic wave propagation within the solid skeleton, the structural dynamics, particularly the first mechanical bending mode of the porous slab, must be considered. For soft elastic materials like PU foam, this fundamental frame resonance typically occurs at relatively low frequencies, around or below 800 Hz for large panels. The target frequency band of 1000–8000 Hz considered in this study is located well above this first mechanical bending mode. Under these high-frequency conditions, the foam skeleton is effectively decoupled; consequently, structural sound transmission through the solid skeleton becomes negligible compared to the airborne propagation through the fluid phase. Therefore, the JCA model provides a physically sound and valid approximation for predicting the acoustic performance of the materials within the scope of this study.
3 Confirmation of the finite element simulation model for porous materials
3.1 Simulation model
This study utilizes the Pressure Acoustics – Frequency Domain module in COMSOL Multiphysics 6.2 [18] to simulate the sound absorption performance of porous materials. A finite element model was constructed to replicate the standard impedance tube test setup, as shown in Figure 3. The model represents a tube with a diameter of 29 mm and employs a mesh consisting of triangular and rectangular elements. The red dashed line indicates the symmetry axis of the 2D axisymmetric model. Boundary conditions are defined as follows: the left end is set as a Perfectly Matched Layer (PML) to simulate an infinite, non-reflective air domain; the middle section applies a background pressure field to represent the perpendicular incidence of a plane sound wave; and the right end is set as a hard sound boundary. The porous material region is characterized using the JCA model described previously.
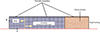 |
Figure 3. Finite element modeling for sound absorption coefficient testing of porous materials. |
3.2 Experimental simulation model confirmation
To validate the accuracy of the JCA model and the finite element (FE) simulation approach used in this study, a comparison was made between a numerical simulation and established experimental data for a uniform porous material. The material chosen for this validation is the polyurethane (PU) foam from the study by Liu et al. [18]. A cylindrical sample of this material with a thickness of 30 mm, as shown in Figure 4, was used for the experimental measurement. The five key JCA acoustic parameters for this material, which were experimentally determined and are listed in that reference, are adopted for this study and presented in Table 2.
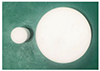 |
Fig. 4. Porous material test samples. |
PU material parameters.
Figure 5 presents the comparison between the experimental data from the study by Liu et al. [18] and the results of the FE simulation performed in this study. The test frequency range is set from 1000 to 8000 Hz. As shown in the figure, the two curves show close agreement across the frequency range of 1000–8000 Hz. This successful replication and validation confirm that the JCA formulation and the FE modeling approach are accurately implemented and can reliably predict the acoustic performance of the porous material. This provides the necessary confidence to use this validated method for the subsequent analysis of graded porous structures.
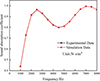 |
Figure 5. Validation of the simulation model: Comparison with experimental data for a uniform PU foam sample from Reference [18]. |
3.3 Simulation analysis of sound insulation performance of materials with gradient airflow resistivity
3.3.1 Influence of airflow resistivity on sound absorption and insulation performance
PU is a commonly used sound-absorbing material in acoustic packages. In this study, a baseline PU material with properties similar to the validated sample is used to conduct a gradient analysis of airflow resistivity, with the relevant parameters provided in Table 3. For convenience in the parametric study, a rounded baseline airflow resistivity of 11 600 N⋅s/m4 is adopted.
Parameters of polyurethane foam.
To design multi-layer acoustic packages with a gradient structure, the effect of airflow resistivity on the performance of a single-layer PU material is first investigated. For this purpose, a series of fictitious PU materials are defined to systematically isolate the influence of this single parameter.
Starting from the baseline PU material properties listed in Table 3, only the airflow resistivity was progressively increased, taking on respective values of 11 600, 21 600, 31 600, 41 600, 51 600, and 61 600 N⋅s/m4, while the other four JCA parameters were kept constant. It should be noted that this is a purely numerical investigation; in a real physical material, all JCA parameters are intrinsically linked through their common dependence on the material’s microstructure, making such an independent modification practically unachievable. The thickness of all material samples was set to 30 mm. The sound absorption coefficients within the frequency range of 1000–8000 Hz were calculated using the validated finite element model.
As shown in Figure 6, the sound absorption coefficient curve exhibits multiple peaks and valleys. At the first absorption peak near 2200 Hz, the absorption coefficient initially increases from 11 600 to 21 600 N⋅s/m4, but then decreases as airflow resistivity is further increased. Conversely, in the absorption valley around 4500 Hz, the absorption coefficient generally improves as airflow resistivity increases up to 41 600 N⋅s/m4, where it reaches its highest value of approximately 0.890.
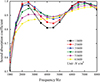 |
Figure 6. Effect of airflow resistivity on sound absorption coefficient. |
A key trend is observed at higher resistivity values. When the airflow resistivity is increased beyond approximately 41 600 N⋅s/m4 to values such as 51 600 and 61 600 N⋅s/m4, the sound absorption coefficient shows a decreasing trend across nearly the entire frequency spectrum. This indicates that while a certain level of airflow resistivity is beneficial for sound dissipation, excessively high resistivity leads to a significant impedance mismatch at the material’s surface, causing more sound to be reflected rather than absorbed. This observation is crucial for defining the optimal range for gradient material design.
To further quantify this relationship, an average sound absorption coefficient was calculated for each material by averaging the values at the octave center frequencies of 1000 Hz, 2000 Hz, 4000 Hz, and 8000 Hz. Concurrently, the total SPL in the receiver cavity for each case was determined using the VTL model. Figure 7 illustrates the relationship between these two metrics.
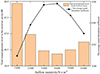 |
Figure 7. Effect of airflow resistivity on the total SPL in the receiver cavity and the average sound absorption coefficient. |
Figure 7 indicates an inverse relationship between the average sound absorption coefficient and the total SPL in the receiver cavity. This observation can be explained by the theory of enclosures, specifically through the concept of system insertion loss (IL) established in the methodology. As the material’s average sound absorption coefficient increases, it more effectively dissipates reverberant energy within the source cavity. This dissipation reduces the sound pressure incident on the partition, which enhances the total system IL and, in turn, leads to the observed decrease in the receiver cavity’s total SPL.
The data shows that the average sound absorption coefficient reaches its maximum value of approximately 0.858 when the material’s airflow resistivity is 41 600 N⋅s/m4. At this point, the corresponding total SPL in the receiver cavity is at its minimum, about 66.4 dB, which is 1.6 dB lower than that of the original material. While the TL of the material is not directly plotted in this figure, the reduction in the receiver cavity’s SPL serves as a direct indicator of the improved overall insulation performance.
A comprehensive analysis reveals that as the airflow resistivity continues to increase beyond this point, the average sound absorption coefficient begins to decline. Based on this observation for single-layer materials, 41 600 N⋅s/m4 was defined as the upper limit of airflow resistivity for the subsequent design of the graded materials.
3.3.2 Effect of airflow resistivity structure on sound insulation performance
In this paper, a step-wise graded structure is constructed by stacking two layers of uniform PU material with different airflow resistivities. This section investigates the TL of two-layer, step-wise graded structures made from the PU material outlined in Table 3. Two primary configurations, as defined in Section 2, are compared: a low-to-high resistivity gradient structure and a high-to-low resistivity gradient structure. For this comparison, the total thickness of the material is kept at 30 mm, with each of the two layers being 15 mm thick. The specific airflow resistivity values for each layer in the different configurations are specified in Table 4. All other JCA parameters remain unchanged. The TL for each configuration was calculated using the VTL model, and the results are presented in Figure 8.
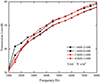 |
Figure 8. Comparison of TL of structural materials with different gradients. |
Configuration of the airflow resistivity of each layer for materials with different gradient structures.
As shown in Figure 8, the TL for all two-layer gradient configurations increases with frequency. A key observation is that the orientation of the gradient has a notable effect on the performance: the low-to-high resistivity gradient structures consistently exhibit a higher TL than their high-to-low counterparts, particularly at lower frequencies.
This directional difference can be explained by the dual mechanism of IL discussed in the methodology. While the acoustic reciprocity principle suggests that the TL of a simple passive partition should be independent of orientation, this does not fully apply here. In the VTL model, the porous material also acts as a sound absorber within the source cavity. Since the surface impedance is different for each orientation, the absorption characteristics vary. This leads to different system-level IL, which are reflected as the observed differences in the calculated TL.
The magnitude of this directional difference depends on the resistivity gradient. For the smaller gradient (11 600–21 600 N⋅s/m4), the TL curves for both orientations are relatively close. However, as the gradient becomes steeper (11 600–41 600 N⋅s/m4), the gap in TL becomes more pronounced. In this latter case, the low-to-high resistivity structure’s TL is significantly higher in the 1000–3000 Hz range, with a maximum difference of approximately 6.6 dB at 1500 Hz.
The VTL model is used to compare the performance of the gradient materials listed in Table 4 against two single-layer PU materials. These single-layer references have a thickness of 30 mm and airflow resistivities of 21 600 N⋅s/m4 and 41 600 N⋅s/m4, respectively. The resulting total SPL in the receiver cavity are shown in Figure 9.
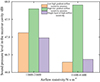 |
Figure 9. Comparison of SPL in receiver cavities of different gradient structure materials. |
It can be seen from Figure 9, among two groups of gradient materials with the same thickness, the total SPL in the receiver cavity of the high-to-low resistivity gradient structural material is higher than that of the low-to-high resistivity gradient structure and the single-layer high-to-low resistivity material in the gradient materials. In addition, comparing the total SPL in the receiver cavities of the high-to-low resistivity gradient structures in the two groups of materials, it can be seen that the total SPL in the receiver cavities increases when the airflow resistivity of the first layer increases. The results show that the sound insulation performance of the high-to-low resistivity gradient structure is lower than both the low-to-high resistivity gradient structure and the porous material itself. Additionally, increasing the airflow resistivity of the first layer further reduces its sound insulation performance.
Comparing the results of the low-to-high resistivity gradient structure across the two groups, it can be observed that increasing the airflow resistivity of the second layer significantly reduces the total SPL in the receiver cavity. When the airflow resistivity of the second layer is increased to 41 600 N⋅s/m4, the sound insulation performance of the low-to-high resistivity gradient structure surpasses that of the single-layer material with the same airflow resistivity of 41 600 N⋅s/m4. These results indicate that appropriately increasing the airflow resistivity of the second layer can enhance the sound insulation performance of the gradient material, making it more effective than a single-layer material with a higher airflow resistivity.
According to the results of sound insulation and total SPL in the receiver cavity, the high-to-low resistivity gradient structure cannot show the sound insulation effect of the material with high airflow resistivity, but rather weakens the sound insulation performance of its constituent materials. The low-to-high resistivity gradient structure improves sound insulation at low and medium frequencies and reduces the total SPL in the receiver cavity. Proper arrangement of the back layer materials’ airflow resistivity enhances sound insulation beyond that of each layer alone. Therefore, the low-to-high resistivity gradient structure is chosen as the optimal solution to enhance the sound insulation performance of gradient PU.
3.3.3 Study on the number of layers of gradient airflow resistivity materials
Based on the low-to-high airflow resistivity structure, the effect of the number of layers of gradient material on the total SPL is investigated by simulation. The total thickness of each type of multi-layer gradient material in this section is set to 30 mm, and the thickness of each layer is equal. For all configurations the first layer’s resistivity is fixed at 11 600 N⋅s/m4 and the final layer’s resistivity is fixed at 41 600 N⋅s/m4. The remaining parameters are kept constant, while the airflow resistivity of the intermediate layers increases progressively in a linear manner, creating the gradient structure.
Reference [21] points out that the number of layers of multi-layer porous materials with a certain thickness should not be excessive, otherwise the thickness of each layer would be too low, resulting in significant differences in pore shape between the upper and lower layers, which will affect the stability of the hole structure. Therefore, the gradient material is increased from a two layer to four graded materials of 3, 4, 5, and 6 layers, respectively, and the airflow resistivity of each layer as shown in Table 5.
Configuration of the airflow resistivity of each layer of materials with different gradient layers.
The four types of gradient materials in Table 5 were applied to the sound insulation test SEA model to obtain the total SPL in each receiver cavity as shown in Figure 10.
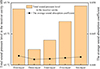 |
Figure 10. Total SPL in the receiver cavity and average sound absorption coefficient of different layers of gradient structure materials. |
As shown in Figure 10, when the porous material is divided into several layers of equal thickness while keeping the total airflow resistivity constant, its TL changes with the number of layers, which in turn affects the SPL in the receiver cavity. Specifically, when the number of layers increases from two to three, the total SPL in the receiver cavity experiences a marginal decrease. However, as the number of layers continues to increase, the SPL in the receiver cavity exhibits a slight upward trend for each additional layer. When the gradient material is divided into six layers, the total SPL in the receiver cavity becomes similar to that of the two-layer material. These results suggest that, under the same airflow resistivity distribution, when the number of layers exceeds a certain threshold, further increasing the number of layers can reduce the sound insulation performance of the gradient material.
Furthermore, since the total thickness and overall resistivity range are fixed, the average sound absorption coefficient shown in Figure 10 remains relatively constant across all layer configurations. This indicates that the drop in SPL observed for the three-layer configuration is not driven by enhanced sound absorption, but rather indicates an improvement in the overall sound insulation performance of the gradient structure.
Consequently, the three-layer structure with an airflow resistivity distribution increasing from low to high is selected as the optimal configuration. This specific gradient design is subsequently applied to the acoustic packages of the automotive roof and dash for further simulation analysis.
3.3.4 Simulation of the application of gradient material in the acoustic package of the roof
To evaluate the potential of the gradient material in more realistic scenarios, the optimized design was applied to simplified SEA models of an automotive roof and dash. It is critical to note that these models, while based on realistic geometries, do not capture all the detailed structural and boundary differences between a real roof and a dash. Therefore, the following analysis is intended as a comparative study to understand how the material’s performance might vary in different application environments, rather than as a precise prediction of vehicle-level accuracy.
The finite element model of the roof and dash of a certain model is imported into VA One software, and the SEA subsystems are constructed accordingly. The subsystems are divided to meet key SEA validity criteria. The primary criterion is ensuring a sufficiently high modal density, defined as the number of resonant modes per frequency band; in this paper, the modal density of each subsystem is greater than or equal to five. Additionally, connected subsystems should have comparable modal behavior to satisfy the modal similarity criterion, ensuring accurate energy transfer modeling.
The specific model for the roof assembly was constructed as follows: the roof sheet metal was divided into two subsystems representing its 0.7 mm and 0.8 mm thick steel sections, as shown in Figure 11. An acoustic cavity representing the vehicle interior was created beneath the roof structure to act as the receiver room. The excitation was modeled as a diffuse acoustic field incident on the exterior surface of the roof, simulating aerodynamic noise. The TL of the entire roof assembly was then calculated. A similar modeling approach was used for the vehicle dash application discussed in Section 3.3.5, where the front panel sheet metal with a thickness of 0.8 mm was divided into six subsystems, with all through holes modeled as sealed with rubber, as shown in Figure 12.
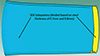 |
Figure 11. SEA model of the roof. |
 |
Figure 12. SEA model of the dash. |
The car roof’s original acoustic package has a three-layer structure. The first layer, closest to the sheet metal, is a 20 mm thick PU. The middle layer is 10 mm thick sound-absorbing cotton. The outermost layer is 3 mm thick acoustic felt. The materials of the PU and acoustic felt in the roof acoustic package are the same as those in the dash acoustic package. The material parameters of the sound-absorbing cotton are shown in Table 6.
Parameters of sound-absorbing cotton material for roof sound package.
Table 7 shows the structure of the original and new roof acoustic packages. As the original acoustic felt and sound-absorbing cotton were too thin to effectively form a multi-layer gradient structure, the new roof acoustic package design replaces the original PU and cotton layers with a purely PU-based material featuring a gradient airflow resistivity scheme. The outermost acoustic felt layer remains unchanged. The total thickness of the acoustic package is unchanged.
Roof sound package structure.
We applied two acoustic packages, the original and Acoustic Package 4 from Table 7, to the roof SEA model to compare their effect on the roof assembly’s TL. The TL curves, computed using the VTL model, are shown in Figure 13. Both packages improved TL as frequency increased. However, Acoustic package 4 performed significantly better. Its improvement occurred across all frequency bands and the increments basically follow a pattern of increasing and then decreasing. At 1000 Hz, Acoustic package 4 provides the greatest improvement in TL, approximately 5.8 dB, and at 2000–4000 Hz, the difference is maintained at 2–4 dB.
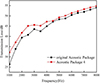 |
Figure 13. TL curves of roof sound package configurations. |
The SPL in the receiver cavity for both configurations is shown in Figure 14. For both the original and the new acoustic package, the SPL decreases as the frequency increases. Acoustic Package 4 demonstrates a notable improvement, particularly in the low to mid-frequency range. At 1000 Hz, the SPL is reduced by approximately 6 dB compared to the original Acoustic package. However, it is worth noting that in the frequency range around 3000–4000 Hz, the performance improvement is less pronounced, with the SPL of both configurations being very close. Despite this, the overall effect is a significant improvement. The total SPL in the receiver cavity is reduced from 71.1 dB with the original Acoustic package to 65.3 dB with Acoustic Package 4, corresponding to an overall reduction of 5.8 dB.
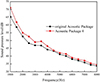 |
Figure 14. SPL curves of the receiver cavity of roof sound package. |
The analysis of the TL and SPL curves shows that replacing the traditional materials with the gradient airflow resistivity PU material improves the TL of the roof assembly, indicating a strong potential for system-level insulation improvement. The roof’s simple structure, free from rigid coupling interference, allows the gradient material’s acoustic impedance to effectively optimize energy dissipation, confirming the design’s effectiveness.
3.3.5 Simulation of the application of gradient material in the acoustic package of the vehicle dash
Based on the simulation results of the roof acoustic package, Acoustic Package 4 demonstrated significant sound insulation benefits in the 1000–8000 Hz frequency band, especially in the lower frequency bands. Therefore, the same gradient structure approach was migrated to the dash acoustic package design. The VTL method is used to establish the acoustic cavity, simulating the noise transmission from the engine to the cockpit. The sound source cavity is located on the outer side of the front panel, while the receiver cavity is situated on the inner side of the front panel. The properties of the two cavities correspond to those in Figure 2, and the analysis frequency ranges from 1000 to 8000 Hz. This paper compares the simulation study of the original acoustic package and the new acoustic package structure of the automobile front panel, as shown in Table 8.
Dash sound package structure.
The original acoustic package is divided into two parts, one part is located on the engine side of the dash, which is made of fiberglass material with a thickness of 20 mm; the other part is located on the driver’s side of the dash, which consists of PU with a thickness of 30 mm and acoustic felt with a thickness of 3 mm. The original parameters of the acoustic felt and fiberglass material are shown in Table 9.
Parameters of dash sound package component materials.
The new acoustic packages are designed based on the gradient airflow resistivity principles outlined in previous sections. These packages replace the PU and fiberglass materials with three layers of gradient materials of equal thickness, forming three scenarios that incorporate gradient materials. The four acoustic packages listed in Table 8 are applied to the corresponding positions on the dash SEA model to assess the effect of the gradient airflow resistivity porous materials on the sound insulation performance. After applying the gradient airflow resistivity structure, the increment in TL for each acoustic package relative to the original acoustic package is shown in Figure 15.
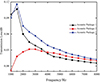 |
Figure 15. Incremental curve of TL for dash sound package. |
Acoustic packages 1, 2, and 3 each show varying degrees of improvement in sound insulation relative to the original acoustic package, and the increments follow a trend of initially increasing and then decreasing gains. The highest sound insulation in the frequency band above 1500 Hz is offered by acoustic package 3, which makes use of gradient materials both inside and outside the front panel. The maximum increase at 1500 Hz is approximately 0.1 dB. As frequency increases, the sound insulation gain from all three acoustic packages gradually decreases.
The improvement in TL for the dash application was also reflected in the total SPL in the receiver cavity. With the original acoustic package, the total SPL was 73.7 dB. With Acoustic Package 3, which achieved a TL improvement of 0.1 dB, the total SPL dropped to 73.6 dB. This negligible reduction of 0.1 dB correlates with the minimal improvement in TL observed for the dash application.
Based on the above simulation analysis of sound absorption coefficient, sound insulation and receiver cavity SPL, it can be concluded that the acoustic package 3 exhibits the best performance among the configurations analyzed. However, the rubber seal in the dash acoustic package limited the effectiveness of the gradient airflow resistivity material. This indicates that the gradient design requires further optimization for rigid boundary applications.
4 Conclusions
This paper investigated a gradient structure formed by a combination of virtual PU materials with different airflow resistivities. The VTL method in VA One was used to study the impact of airflow resistivity, material combinations in various gradient structures, and the effect of the number of gradient layers on the acoustic performance of the materials. This design approach was then applied to automotive acoustic package models.
Simulation results show a correlation between the average sound absorption coefficient of single-layer PU and its overall acoustic performance. Specifically, the low-to-high resistivity gradient structure, with a three-layer material arrangement, exhibits the best sound insulation performance. For materials of the same thickness, the gradient structure generally outperforms any single-layer material in terms of both sound absorption and TL. When applied to automotive acoustic packages, the proposed design demonstrated differing levels of effectiveness. For the roof assembly, which features a simple structural boundary, simulation results show a significant improvement of 5.8 dB in TL and a reduction of 5.8 dB in the receiver cavity’s SPL. This demonstrates the gradient design’s potential in environments with simple structural boundaries. In contrast, the application to the vehicle dash model, which included a simplified representation of rubber seals, resulted in a negligible TL improvement of only 0.1 dB. This simulated performance difference, while based on simplified models, suggests that the effectiveness of gradient materials is highly sensitive to the component’s boundary conditions. Further optimization is needed for complex geometries with rigid constraints.
Critically, the study reveals that the gradient airflow-resistivity material improves the system-level IL of acoustic packages by enhancing both the partition’s TL and the sound absorption within the source-side cavity. For the forward design of acoustic treatments with porous materials, this approach can achieve efficient broadband noise control in limited spaces, and the simulation results confirm its potential for practical applications.
Conflict of interest
The authors have no competing interests to declare that are relevant to the content of this article.
Data availability statement
The research data associated with this article are included within the article.
Author contribution statement
Zhu Keyi: Data curation, Writing- Original draft preparation; Cheng Yuxiang: Writing- Reviewing and Editing; Xiong Xinzhong: Resources; Liu Xuewen: Supervision. All authors have read and agreed to the published version of the manuscript.
References
- S. Chen, Z. Zhou, J. Zhang: Multi-objective optimisation of automobile sound package with non-smooth surface based on grey theory and particle swarm optimisation. International Journal of Vehicle Design 88, 2–4 (2022) 238–259. [Google Scholar]
- Z. Mao, Y. Lin: Application of sound package material in noise reduction of motor. Vibroengineering Procedia 36 (2021) 66–71. [Google Scholar]
- L. Zhen, Y. Zhao, L. Ren, et al.: A method for analyzing and optimizing the performance of automotive sound packages using Biot parameters. Journal Of Chongqing University Of Technology (Natural Science) 36, 11 (2022) 84–92. [Google Scholar]
- J. Dong, F. Ma, C. Gu, et al.: Highly efficient robust optimization design method for improving automotive acoustic package performance. SAE International Journal of Vehicle Dynamics, Stability, and NVH 4, 3 (2020) 291–304. [Google Scholar]
- D. Zhang: Research on preparation and topology optimization method of plant oil polyol polyurethane porous composite materials in vehicles [Ph.D. thesis]. Jilin University, Changchun, 2021. [Google Scholar]
- L. Wu, M. Liu, X. Liu, et al.: Optimal design of structural parameters of multi-layer porous sound-absorbing materials. Applied Acoustics 40, 3 (2021) 449–456. [Google Scholar]
- L. Wu: Research on the structure optimization of composite porous sound-absorbing materials for vehicles [Master’s thesis]. Shanghai University of Engineering Science, Shanghai, 2021. [Google Scholar]
- Z. Li, C. Yang, K. Yan, et al.: Rational design of a polypropylene composite foam with open-cell structure via graphite conductive network for sound absorption. Soft Matter 20, 5 (2024) 1089–1099. [Google Scholar]
- X. Chen, W. Zhao, J. Hu, et al.: Simulation and optimization of a sedan sound package based on the nine parameters of BIOT theory. Noise and Vibration Control 40, 4 (2020) 177–182. [Google Scholar]
- Q. Liu, C. Zhang: Broadband and low-frequency sound absorption by a slit-perforated multi-layered porous metamaterial. Engineering Structures 281 (2023) 115743. [Google Scholar]
- I. Prasetiyo, E. Muqowie, A. Putra, et al.: Modelling sound absorption of tunable double layer woven fabrics. Applied Acoustics 157 (2020) 107008. [Google Scholar]
- J. Wang, Q. Ao, J. Ma, et al.: Sound absorption performance of porous metal fiber materials with different structures. Applied Acoustics 145 (2019) 431–438. [Google Scholar]
- X. Chen, W. Ma, Y. Hao, et al.: Analysis and optimization design for sound absorption performance of gradient elastic porous materials. Journal of Vibration and Shock 40, 9 (2021) 270–277. [Google Scholar]
- J. Tong: Study and optimization of sound absorption properties of gradient porous composite structures [Master’s thesis]. Huazhong University of Science and Technology, Wuhan, 2022. [Google Scholar]
- Y. Cheng, X. Xiong, X. Liu, et al.: Design and sound performance analysis of porous materials with gradient airflow resistivity. Applied Acoustics (2024), (In Press). [Google Scholar]
- J. Boulvert, T. Cavalieri, J. Costa-Baptista, et al.: Optimally graded porous material for broadband perfect absorption of sound. Journal of Applied Physics 126, 17 (2019) 175101. [Google Scholar]
- X. Guan, et al.: Optimization of graded porous acoustic absorbers based on triply periodic minimal surfaces. Materials & Design 253 (2025) 113852. [Google Scholar]
- X. Liu, X. Xiong, J. Pan, et al.: Airflow resistivity measurement and sound absorption performance analysis of sound-absorb cotton. Applied Acoustics 179 (2021) 108060. [Google Scholar]
- X. Xiong, X. Liu, L. Wu, et al.: Study on the influence of boundary conditions on the airflow resistivity measurement of porous material. Applied Acoustics 161 (2020) 107181. [Google Scholar]
- J. Allard, N. Atalla: Propagation of Sound in Porous Media: Modelling Sound Absorbing Materials, 2nd edn. John Wiley & Sons, Chichester, UK, 2009. [Google Scholar]
- J. Zhu, J. Sun, H. Tang, et al.: Gradient-structural optimization of metal fiber porous materials for sound absorption. Powder Technology 301 (2016) 1235–1241. [Google Scholar]
Cite this article as: Zhu K. Cheng Y. Xiong X. & Liu X. 2026. Investigating sound insulation performance of gradient airow resistivity porous materials. Acta Acustica, 10, 35. https://doi.org/10.1051/aacus/2026031.
All Tables
Configuration of the airflow resistivity of each layer for materials with different gradient structures.
Configuration of the airflow resistivity of each layer of materials with different gradient layers.
All Figures
|
Figure 1. Schematic diagram of gradient airflow resistivity structure. |
| In the text | |
|
Figure 2. Schematic of the VTL model setup. |
| In the text | |
|
Figure 3. Finite element modeling for sound absorption coefficient testing of porous materials. |
| In the text | |
|
Fig. 4. Porous material test samples. |
| In the text | |
|
Figure 5. Validation of the simulation model: Comparison with experimental data for a uniform PU foam sample from Reference [18]. |
| In the text | |
|
Figure 6. Effect of airflow resistivity on sound absorption coefficient. |
| In the text | |
|
Figure 7. Effect of airflow resistivity on the total SPL in the receiver cavity and the average sound absorption coefficient. |
| In the text | |
|
Figure 8. Comparison of TL of structural materials with different gradients. |
| In the text | |
|
Figure 9. Comparison of SPL in receiver cavities of different gradient structure materials. |
| In the text | |
|
Figure 10. Total SPL in the receiver cavity and average sound absorption coefficient of different layers of gradient structure materials. |
| In the text | |
|
Figure 11. SEA model of the roof. |
| In the text | |
|
Figure 12. SEA model of the dash. |
| In the text | |
|
Figure 13. TL curves of roof sound package configurations. |
| In the text | |
|
Figure 14. SPL curves of the receiver cavity of roof sound package. |
| In the text | |
|
Figure 15. Incremental curve of TL for dash sound package. |
| In the text | |
Current usage metrics show cumulative count of Article Views (full-text article views including HTML views, PDF and ePub downloads, according to the available data) and Abstracts Views on Vision4Press platform.
Data correspond to usage on the plateform after 2015. The current usage metrics is available 48-96 hours after online publication and is updated daily on week days.
Initial download of the metrics may take a while.