Figure 2
Download original image
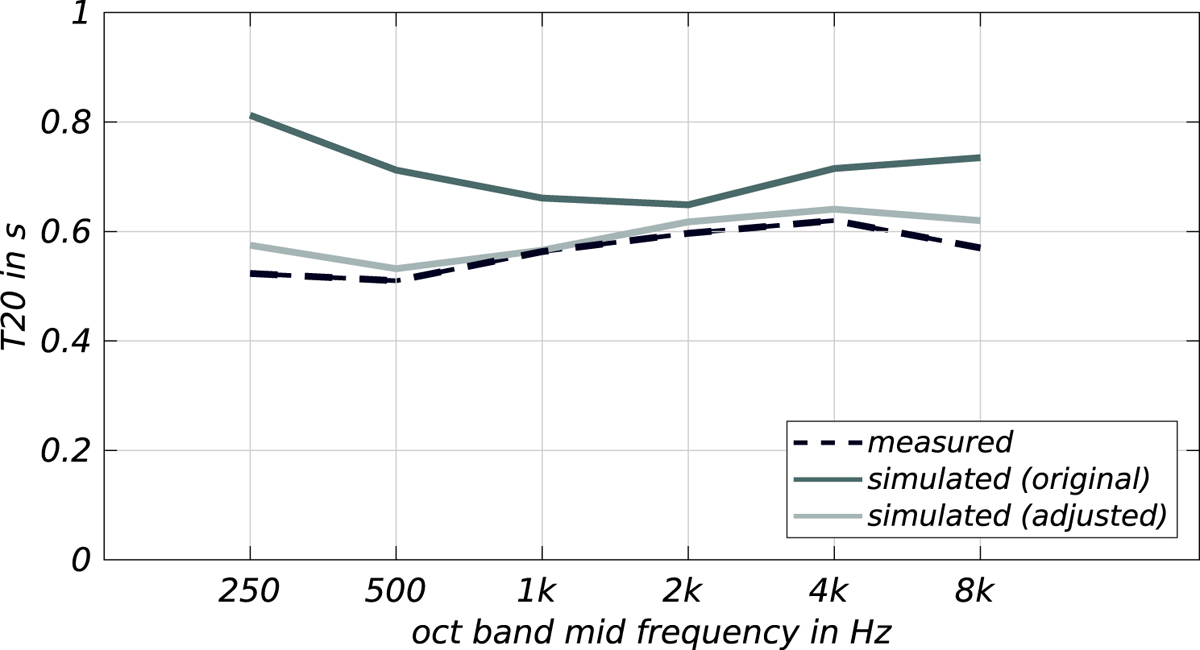
Measured and simulated reverberation times at the subject’s position, averaged over the three loudspeaker positions. The dashed line represents measured values (using a typical measurement microphone). The solid lines represent simulated values using the RAZR simulation package, with absorption coefficients originally estimated from inspection of the walls (darker line) and adjusted absorption coefficients (lighter line).
Current usage metrics show cumulative count of Article Views (full-text article views including HTML views, PDF and ePub downloads, according to the available data) and Abstracts Views on Vision4Press platform.
Data correspond to usage on the plateform after 2015. The current usage metrics is available 48-96 hours after online publication and is updated daily on week days.
Initial download of the metrics may take a while.