| Issue |
Acta Acust.
Volume 10, 2026
|
|
|---|---|---|
| Article Number | 17 | |
| Number of page(s) | 18 | |
| Section | Virtual Acoustics | |
| DOI | https://doi.org/10.1051/aacus/2026012 | |
| Published online | 17 March 2026 | |
Scientific Article
Perceptual effects of modified late reverberation and reverberation time in auditory augmented reality in two rooms
1
Technische Universität Ilmenau, Ilmenau, Germany
2
Institute of Sound Recording, University of Surrey, Guildford, UK
* Corresponding author: This email address is being protected from spambots. You need JavaScript enabled to view it.
Received:
3
May
2025
Accepted:
4
February
2026
Abstract
This paper presents two experiments investigating perceptual tolerances regarding deviations in the late reverberation of a room in augmented reality (AR) audio rendering. The study is based on binaural room impulse responses (BRIRs) measured with a KEMAR head-and-torso simulator in two seminar rooms with reverberation times (RTs) of about 0.4 s and 1.1 s. We implemented an algorithm to modify the RT while maintaining the spectral profile of the room’s reverberation. In a single stimulus listening test design, participants had to rate externalization, audiovisual plausibility, and room perception for different RT scalings. Differentiating between audiovisual plausibility for source and room helped capture the different perceptual phenomena. In this context, the concept of room acoustic signature preservation has also been proposed. The results indicate that in the reverberant room, RT deviation of 0.1 s already reveal that the acoustics of the room are different. However, plausible illusions in AR can be maintained despite significant perceptible deviations in RT, considering the original early room response. For originally short RT, audiovisual source plausibility is even robust towards larger RT modifications.
Key words: Augmented reality / AR / Reverberation / Perception / Audio rendering
© The Author(s), Published by EDP Sciences, 2026
 This is an Open Access article distributed under the terms of the Creative Commons Attribution License (https://creativecommons.org/licenses/by/4.0), which permits unrestricted use, distribution, and reproduction in any medium, provided the original work is properly cited.
1 Introduction
Audio Augmented Reality (AAR) aims to enhance the real environment, for example, by adding virtual sound sources. Typically, applications either aim for AR experiences as similar as possible to reality or aim for creating experiences that are not possible in reality [1]. Virtual sound sources that blend seamlessly with the natural sound field, can be created using environment-aware dynamic binaural synthesis. Measuring or simulating binaural room impulse responses (BRIRs) enables to create the illusion of virtual sound to originate from external sound sources within the real environment. For this illusion to be convincing, the auralized room acoustics must align with the listener’s expectations in the AR scenario. Kuhn-Rahloff [2] defined the term plausibility as the degree to which a listener’s expectations are fulfilled in the context of electro-acoustic reproductions. This definition was adopted for dynamic binaural audio by Lindau and Weinzierl [3]. Also, for AR audio rendering, listener expectations form the perceptual guidelines. However, how these expectations are formed, and to which degree they constrain perceptual tolerances, is not yet fully understood [4]. Naturally, these expectations are influenced by sound sources in the real environment, which serve as external references for the virtual sound objects [5–8]. Furthermore, it is important to understand the different manifestations of plausibility. On the one hand, the term is used to describe whether the virtual content cannot be revealed with confidence [3, 7]. On the other hand, plausibility can refer to the perception of a coherent auditory scene despite being obviously unreal [9–11]. In [12], Slater coined the term plausibility illusion (Psi) as the illusion that the presented virtual scenario is actually occurring. He further notes that such illusions can arise even when users consciously know the environment is not real, much like classical visual illusions (e.g., the Müller–Lyer illusion) or a hologram continue to produce a compelling percept despite explicit awareness of their unreality.
The studies presented in this article examine the plausibility of the illusion that a loudspeaker is emitting sound in two different acoustic environments. The question is, which specific features of the room’s acoustics contribute to what extent to creating a highly plausible auditory illusion. Which perceptual implications can be expected from deviations between virtual and real room acoustics.
Throughout this article, we use the term plausibility as proposed by Kuhn-Rahloff and measure the degree to which the listener expectations are met on a scale. Specifically for AR spatial audio, we refer to (audiovisual) plausibility as the expected alignment of auditory and the visual cues to create a believable and consistent experience.
Previous research has already addressed the implications for the quality of binaural auralization in cases of strong divergence between the synthesized and reproduction room, for example, degradation of externalization [13]. However, findings by Neidhardt [14] showed that not every diverging condition will automatically impair the plausibility of the auditory illusion. Understanding perceptually tolerated deviations between the real and virtual reverberant fields is necessary to evaluate the suitability of different algorithms in the field of blind room acoustic estimation. Blind room acoustic estimation helps to embed the auralization into previously unknown environments without the need for dedicated room acoustic measurements [15–18].
Having a deeper understanding of the accepted mismatch between virtual and real acoustics may further enable targeted manipulations of the virtual room acoustics, thereby enhancing the experience of an AR scenario. Sometimes, the goal of a sound designer may be to create virtual content that is not intended to mimic reality, for example, to achieve specific aesthetic goals [19]. An example may be the virtual enhancement of the reverberation in a specific environment. In such cases, modifying the virtual room acoustics produces inherently perceivable differences between the real and virtual room. Even in cases where the reverberance is a matter of taste, or the context of the specific AR scenario that is being designed, plausibility remains a requirement.
Therefore, the experiments presented in this paper were designed to investigate the perceptual implications of modified late reverberation and reverberation time in an AR scenario with a virtual sound source. The reverberation time (RT) of a set of measured BRIRs was modified by replacing the late reverberation segment with synthesized reverberation tails of varying decay times. The original early reflection patterns are preserved to maintain the spatial appearance of the rendered virtual source. Listeners can explore the scenes by walking along a defined path in front of a real loudspeaker playing virtually. The experiment was carried out in two locations, a dry and a very reverberant seminar room. Furthermore, the experiment includes a condition with an additional real loudspeaker playing concurrently with the binaural reproduction. This condition is used to explore whether the presence of a real sound source influences the perceived quality of the created illusion. Informal pretests suggested that listeners distinguish between the plausibility of the loudspeaker playing and the plausibility of the reverberation in the given room. To capture these effects, three new perceptual attributes, focusing on either the source or the room, are explored.
The article is organized as follows: Section 2 presents an overview of concepts and related research for this study. Section 3 describes the general data processing and auralization method. This is followed by Section 4, introducing the test methodology for both listening experiments. Sections 5 and 6 present the two experiments, which encompass aspects specific to each experiment, as well as their respective results. Section 7 compares and discusses the results of both experiments followed by Section 8, which concludes this study.
2 Background
A series of studies conducted by Werner et al. [13] showed that the quality of virtual sound sources can be affected in the case of strong divergence between the auralized room acoustics and the acoustics of the reproduction environment. In their experiments, binaural measurements from an acoustically dry room were auralized in a reverberant one and vice versa. They demonstrated that in such a considerable mismatch of room acoustics, externalization of the sound image can be severely impacted. Divergent room acoustic conditions were also considered in [5], where different paradigms for testing transfer-plausibility were compared. In the experiment, BRIRs measured in a variable acoustic environment under different conditions were used for the auralization. This resulted in either more or less reverberant conditions relative to the room’s acoustic conditions in the listening experiment. It was found that such mismatching conditions reduce the probability of a virtual sound event being perceived as real.
However, plausible illusions in AR can still be maintained under certain deviations in virtual room acoustics, as shown by Neidhardt et al. [20–22]. In these experiments, a selection of BRIR manipulations was tested for auralizing an AR audio scenario in a reverberant and dry room, respectively. In three experiments, participants explored a virtual sound source by walking along a 2 m long line and turning their heads. Manipulations to the BRIRs were introduced mainly to the early part of the impulse responses, like using a constant early reflection pattern for all positions while only adjusting the direct sound level. The results indicate a potential for certain simplifications and manipulations that do not affect plausibility. This finding aligns with those from [23], which demonstrate that plausibility can be sustained despite diverging early reflection patterns in certain scenarios. These scenarios primarily involved a strong direct sound, indicating that the accuracy of rendering early reflections depends on the source’s directivity and the source-receiver position. The question is whether a similar acceptance of room acoustic differences exists when modifications are introduced to the late reverberation tail of the room response.
Several studies investigated the sensitivity to changes in the reverberation time with reported just-noticeable differences (JNDs) ranging from about 5% up to 39% [24–28]. This wide range of values is the result of different test conditions in each of these experiments, especially regarding the utilized stimuli, ranging from synthetic noise bursts to traditional Chinese instruments. Perceived reverberance has been shown to depend on the signal [29]. Listeners showed reduced accuracy in matching reverberation times across different signals compared to identical ones. Their results also suggest that the auditory system lacks a robust temporal representation of the late reverberation tail. As a consequence, Osses et al. [30] proposed a measure for reverberance that considers the source signal as well. This raises the question of how reverberance relates to reverberation time for different types of signals.
Another aspect to consider for sound in AR is the availability of a real reference [7] or nearby real sound sources that reproduce sound alongside the virtually produced ones [6, 31]. The real environment influences the expectation towards the rendered AR audio [32]. It introduces a form of reference to the listener as the real loudspeakers excite the real acoustic environment. To address this effect, the concept of transfer-plausibility was proposed and can be used to assess the quality of the auditory illusion in AR [8, 33]. It requests to rate virtual sound sources alongside real ones. However, the term was introduced with the goal of creating virtual sound sources that are confused with being real and not revealed as virtual. In contrast, the present work does not aim at indistinguishability from reality, but at assessing whether virtual sound sources can coexist and perceptually integrate with real sources despite detectable deviations in room-acoustic cues.
The initial concept of modifying the reverberation time in a measured BRIR for these questions was explored in [34]. The experiment was set up in a reverberant seminar room with a T30 of about 1.1 s. A BRIR data set measured along a 2 m-long line in 25 cm steps with a horizontal resolution of 4° was used for the modification process. The late reverberant tails of the measured data set were substituted with a frequency-dependent decaying binaural noise sequence of different lengths to simulate different decay times. In the listening experiment, the auralization of a virtual sound source was presented over a pair of extra-aural headphones (AKG K1000) using different modified BRIR data sets. The participants had to rate two questions. First, whether they perceive the sound source outside of their heads, and second, if they had the impression that the sound was coming from the loudspeaker they see. The subjects provided ratings twice: first while restricted to standing still with head rotation only (position-static), and second while permitted to move freely along the line (position-dynamic). The results from this experiment indicate a strong resilience of externalization to reverberation time divergence, whereas audiovisual plausibility was affected even by moderate deviations. Allowing the use of translational movement also appeared to have a facilitating effect on improving ratings of externalization. Such an effect has been shown for head rotation in binaural audio by Brimijoin et al. [35].
3 Data processing
The main conditions in the presented experiments focus on decay rate deviations of the late reverberation tail of measured BRIRs. Therefore, a process for creating and modifying binaural late reverberation tails is implemented, which allows for parametric alteration of the reverberation time.
The beginning of the late reverberation tail is determined by the mixing time estimated using the model-based estimators proposed by Lindau et al. [36]. Analysis and synthesis of the tails was conducted per frequency band using a 1/6-octave filter bank to generate subband signals in the range of 50 Hz–24 kHz [37].
Two distinct methods were applied for the analysis and synthesis of the mid-to-high and low frequency part of the late reverberation tails, respectively. The first method focuses on synthesis via frequency-dependent decaying noise. The second method is based on the estimation of modal parameters, allowing for reconstruction using an exponential decaying sinusoidal model [38]. Subbands below 188 Hz were processed using this modal reconstruction, while subbands above this frequency were processed using the binaural noise. The transition frequency corresponds to the edge frequency of subband N. The choice of this frequency was based on the Schroeder frequency of the room in Experiment B of about 180 Hz. The following two subsections describe both of these methods.
3.1 Late reverb synthesis with binaural white noise (for high frequencies)
This approach exploits the stochastic nature of the late reverberant tail of the BRIRs. After a certain time period, the increasing echo density reaches a degree of diffuseness in the sound field that can be approximated using frequency-dependent decaying noise sequences [39]. For this study, a binaural white noise sequence with diffuse field interaural coherence properties was used, as described in [40]. This binaural white noise sequence is also processed by the same filter bank mentioned above.
First, decay curves are estimated for every sub-band signal of the BRIR by computing the Schroeder energy decay function (based on the squared sub-band response) and then taking the square root of that energy curve to obtain the amplitude envelope. The resulting decay curves, denoted as e c, k [n], where c is the stereo channel index (left/right), k is the subband index, and n is the time index, are applied to the corresponding subbands of the binaural white noise Nc, k[n] and summed to produce the synthesized reverb tail hc[n]:
![Mathematical equation: $$ \begin{aligned} h_{c} [n] = \sum _{k} N_{c,k}[n] \cdot e_{c, k}[n]. \end{aligned} $$](/articles/aacus/full_html/2026/01/aacus250056/aacus250056-eq1.gif) (1)
(1)
Afterward, the shaped noise bands are scaled to have the same energy as the original subband of the BRIR.
To modify the reverberation time in a specific subband, the respective decay curve is resampled using linear interpolation. For each of the two rooms, one binaural late reverb tail was considered per scaling as the late reverberant field was assumed not to significantly change along the considered area and be perceptually direction-independent after the mixing time [36]. This also significantly decreases the time required for processing the data sets.
3.2 Modal reconstruction (for low frequencies)
Small rooms often show a strong modal behavior. Especially in rectangular-shaped rooms, standing waves result in constructive and destructive interference, depending on the frequency and room dimensions. Furthermore, the strength of a mode is position-dependent and, therefore, changes with a listener’s translational movement. In order to account for this case of amplified and attenuated modes, the synthesis and modification of the low-frequency part of the late reverberation tail were done using the Exponentially Damped Sinusoidal (EDS) model [41, 42], where the impulse response is modeled as
![Mathematical equation: $$ \begin{aligned} \widetilde{h}[n] = \sum _{m=0}^{M-1}e^{a_{m}+j\varphi _{m}-n(\alpha _{m}+j2\pi f_{m}) } \end{aligned} $$](/articles/aacus/full_html/2026/01/aacus250056/aacus250056-eq2.gif) (2)
(2)
with ![Mathematical equation: $ \widetilde{h}[n] $](/articles/aacus/full_html/2026/01/aacus250056/aacus250056-eq3.gif) denoting reconstructed impulse response at discrete time index n, M denoting the number of modes, a
m
the starting log-amplitude, α
m
the amplitude change, φ
m
the phase, and f
m
, the frequency of the mode.
denoting reconstructed impulse response at discrete time index n, M denoting the number of modes, a
m
the starting log-amplitude, α
m
the amplitude change, φ
m
the phase, and f
m
, the frequency of the mode.
To determine the modes’ frequency, phase, and damping values, a modal estimation scheme utilizing ESPRIT is employed [43, 44]. Although computationally demanding, impulse response synthesis from modal estimates using ESPRIT has been shown to achieve Mean Squared Error (MSE) levels as low as −120 dB [44].
Controlling the decay time of individual modes can be achieved by modifying the damping factor of the respective sinusoid.
In order to avoid audible artifacts, the initial damping factor α m, 1 is changed to a target α m, 2 over a transition period of N r samples using a raised cosine window w(u) starting at n s :
![Mathematical equation: $$ \begin{aligned} \alpha _m[n]=&{\left\{ \begin{array}{ll} \alpha _{m,1},&n \le n_s,\\ \alpha _{m,1} + \mathrm{\Delta }\alpha _m\, w(u),&n_s < n < n_s+N_r,\\ \alpha _{m,2},&n \ge n_s+N_r, \end{array}\right.}\end{aligned} $$](/articles/aacus/full_html/2026/01/aacus250056/aacus250056-eq4.gif) (3a)
(3a)
 (3b)
(3b)
![Mathematical equation: $$ \begin{aligned} w(u) =&\tfrac{1}{2}\!\left(1-\cos (\pi u)\right), \quad u\in [0,1]. \end{aligned} $$](/articles/aacus/full_html/2026/01/aacus250056/aacus250056-eq6.gif) (3c)
(3c)
In the presented experiments, a transition period of 10 ms was used starting at the estimated mixing time. An overview of this reverberation synthesis method can be found in [45].
Although this allows for the modification of the decay of every mode individually, in this paper, the same decay scaling factor is applied to all modes.
3.3 Auralization
The auralization setups of the two experiments use the Python-based framework pyBinSim [46] for position-dynamic real-time auralization of BRIR datasets. pyBinSim performs uniformly partitioned convolution to process arbitrary audio signals with measured or simulated BRIRs. The partitioned BRIR filters are switched in the processing by receiving external filter update commands that depend on changes in the listener’s positions and orientations. An HTC Vive Tracking system, consisting of a Vive Tracker 3.0 placed on top of the headphones and two Lighthouse base stations, captures the listener’s movement. The pyBinSim framework was further modified to allow for the simultaneous playback of real loudspeakers.
To minimize the influence of headphones distorting the real sound field, a pair of 3D-printed extra-aural headphones [47] was used in both experiments. For both headphones, an individual equalization filter was created based on the headphones’ transfer functions measured, five times replaced on the KEMAR head-and-torso simulator (HATS).
4 Test methodology
In this study, the goal is to create the illusion that a real loudspeaker is reproducing sound. Measured and synthesized BRIR datasets are used to emulate the sound reproduction of a loudspeaker standing in the room via headphone-based binaural synthesis. Listeners explore the scene with head rotation in the horizontal plane and moving on a line (see Figs. 1 and 2) at a fixed head height. In contrast to other studies, e.g. [7], the test considers only the virtual loudspeaker reproduction to be rated. The test design for both experiments is a Multi-Attribute Absolute Category Rating (MAACR). Each test item (room acoustic condition and test signal) was presented separately and subsequently, similarly to [21, 22]. The participants had to answer five questions, reported in Table 1. A six-point Likert scale was chosen as proposed by Neidhardt [14]. Table 2 shows the definition of the ratings scale.
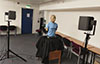 |
Figure 1. Illustration of the setup in the LTC seminar room at the University of Surrey, indicating all source and receiver positions used for the measurement. The rectangles depict the positions of tables, which were moved to the walls for the experiment. The black dots on the red line depict the nine measurement positions. |
List of questions for the evaluation.
Six-point rating scale of the experiment.
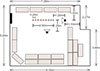 |
Figure 2. The Room sketch of the seminar room used in Experiment B. The black dots indicate the nine equally spaced measurement positions along the 2 m long line. |
Question I (Q.I) addresses potential effects on the externalization of the virtual sound source. However, ratings for externalization do not necessarily reveal whether the virtual sound source is also perceptually mapped onto the real loudspeaker.
Therefore, Q.II targets the impression that the loudspeaker is reproducing the sound, which indicates audiovisual plausibility of the loudspeaker and its emulated emission. Results from informal pretests of this study suggested that the different test conditions had only minor effects on the audiovisual plausibility of the sound source. Therefore, we decided to address the perception of the source and the room separately in the evaluation. This is in line with the differentiation between source-related and room-related audiovisual plausibility based on the theoretical concept of audiovisual interactions in AR introduced in [32]. Q.III aims to assess whether the reverberation would be sufficiently similar to be accepted as the original room’s reverberation. Since pre-tests indicated that listeners sometimes find deviating reverberation suitable for the room as well, we added Q.IV to evaluate the audiovisual plausibility of the reverberation for the given room in cases where subjects perceive a difference from the real room.
Furthermore, we aimed to assess an attribute distinct from plausibility, with the goal of addressing aesthetics and preference. Desired reverberation times depend on the context and type of the signal [45, 48, 49]. While it is standard practice in the field to aim for room acoustic rendering that is as realistic as possible, it is also possible that listeners may have a preference for a “false” room acoustic rendering if it provides greater aesthetic value. Similar unrealistic rendering is often used in computer gaming. In this sense, AR could also provide a platform to “beautify” reality by potentially improving the aesthetics of real rooms. For an initial exploration of this area, Q.V was added.
To familiarize participants with the Audio AR setup and their task in the experiment, they were presented with two virtual sound sources. The frontal loudspeaker of the setup “reproduced” (virtually) a male speech signal, while the loudspeaker at the side “reproduced” (virtually) a drum sample loop. The participants were able to listen to both virtual sources separately and simultaneously and interactively modify the late reverberation of both using a Vive controller. At this point, the evaluation questions (Tab. 1) were explained and discussed in detail to avoid misinterpretation and to clarify potential misunderstandings. As a final step, they rated one self-chosen RT scaling with the test questions.
In both experiments, the test was structured into three blocks using two (dry) stimuli. A male speech snippet (Speech, 2 min) [50] and a saxophone solo recording (Music, 30 s) [51]. The stimuli would start from the beginning for every condition and loop in case the listening duration exceeds the length of the stimulus. The order of the first two blocks was randomized, with each block assigned to either the speech or the music stimulus.
The third block always used the speech signal for the frontal (virtual) speaker, while the side (real) loudspeaker was reproducing a drum loop. Since it has been shown that the presence of real sound sources can influence the expectations of the listener [7, 31, 33], with this condition, we want to test for this effect. The test participant and the experimenter, who are in conversation during the experiment, form two real sound sources in the room already. The addition of a real loudspeaker aims at assessing how a further, continuously playing sound source affects the expectation and ratings.
5 Experiment A – Dry Room
Experiment A was conducted in a comparably dry seminar room (SR1) at the University of Surrey named “LTC”. The seminar room has a nearly shoebox-shaped geometry with a size of 8.05 × 5.93 × 2.50 m, a volume of V = 114 m3, and a reverberation time of RT = 0.35 s (average of 500 Hz and 1 kHz). The mixing time was estimated at approximately 50 ms using model-based prediction according to [36]. Table 3 shows the reverberation times estimated in the different octave bands.
 |
Figure 3. Photo of the measurement setup in LTC seminar room. |
Frequency-dependent RT, estimated from measured BRIRs in the different octave-bands.
5.1 Measurement of BRIR data set
Figure 3 shows a photo of the setup for BRIR measurements in the room. A G.R.A.S. Kemar 45BB HATS was placed on an electric turntable (Outline) which was controlled by a specifically designed Arduino unit1. The ears of the Kemar and the center of the two Neumann KH 120 II loudspeakers were located 162 cm above the floor.
BRIRs were measured at nine positions with 25 cm intervals along the 2 m-line, covering distances from 1.25 m to 3.25 m to the front loudspeaker. The measurement was conducted with an angular resolution of 2.5° (144 angles). Exponential sine sweeps ranging from 50 Hz to 22 kHz over a duration of 3 s, followed by a 2 s pause, served as the measurement signal. Figure 1 illustrates the setup in the room and provides the geometric dimensions.
5.2 Test items
The position-dynamic auralization of the original BRIR data set measured in this room served as the reference. Additionally, 13 other test items were created. First, eight different versions of the late reverberation were synthesized according to the description provided in Section 3 to generate different reverberation times. The resulting modified RTs are presented in Table 4.
Comparison of room acoustic parameters. The values were estimated from BRIRs with a distance of 2.25 m from the frontal loudspeaker and 0° orientation. RT(T30), DRR, C20, C50, and t s show the values for the left channel only.
Table 5 provides a brief overview of the test conditions. Informal pretesting during the development of the listening experiment indicated that modifications to the reverberation time alone may have a minor influence on the plausibility of the illusion that the loudspeaker reproduces the sound. Therefore, three more conditions were included to challenge the quality of the auralization. The first additional condition was the original BRIR data set used in Experiment A, consisting of the same loudspeaker arrangement but in a different room with a reverberation time of 1.0 s (see item “SR2” in Tab. 5). Two anchor conditions were included, with truncated BRIRs to contain only information up to 50 ms after the direct sound (Orig_early) and direct sound-only (Anchor), respectively. Additionally, two conditions with monaural late reverberation were added, using the same reverberation tail for both channels. These represent a more severe modification characterized by the absence of diffuse-field interaural coherence, resulting in a perceived lack of spaciousness of the late sound field.
Overview of test items used in the listening experiment.
Table 4 provides a comparison of several room acoustic parameters, including RT, Direct-to-Reverberant ratio (DRR), clarity indices C50 & C20, center time (ts), and interaural cross-correlation coefficients for the early and late segments of the BRIRs for the different conditions. The values in this table were calculated from the left channel of the BRIR measured at a distance of 2.25 m, and orientation 0° azimuth. RT values were averaged over T30 values estimated in the 500 Hz and 1 kHz octave band for both left and right channels. Additionally, Figure 4 visualizes the distribution of the physical parameters for the different modified data sets used in both experiments.
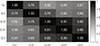 |
Figure 4. Distributions of RT, DRR, C20, C50, and t s for the room conditions available in Experiments A and B. Mono and Anchor conditions are excluded. The parameters were calculated from both the left and right channels of all BRIRs across all orientations and positions. |
5.2.1 Test
The main test consisted of three different test blocks. The first two blocks tested all 14 created room acoustic conditions listed in Table 5 with either dry male speech [50] or a solo saxophone sample. Again, the order of those two blocks was random for every participant. For the third block, the dry male speech was used again. In addition, the real side loudspeaker reproduced the drum loop simultaneously to investigate the influence of an additional real sound source in the room. This block was always tested at the end to avoid the real speaker influencing the other signals as it becomes an active acoustic reference. This may tune a participant’s inner reference and affect the ratings of the following signal conditions [7, 52]. The order of the test items was randomized for each test block and each participant.
5.3 Participants
A total of 19 unpaid volunteers participated in the experiment, 14 of whom were male and five female. The average of the participant group is 23.7 years, ranging from 20 to 43. All participants had an audio engineering background with experience in listening tasks. None of the participants reported having any hearing impairment.
5.4 Results of Experiment A
Before analyzing and discussing the ratings, this section documents comments and statements given by participants during the experiment.
5.4.1 Participant comments and verbal descriptions
For the Anchor, some participants explained that they perceived it in the head, or at least very close to the head, and that the source seems to move along during motion. Some also commented on the severe lack of audiovisual coherence and made fun of the Anchor item, for example, with comments like “What is this?”. These reactions indicate how the anchor stood out as a bad condition.
For the two test cases with the monaural late reverberation, comments differed considerably. For Mono_0.4, they did not diverge much from those given for the reference. Two participants mentioned that the reverb is “strange” and “not spatial”. In contrast, for Mono_0.8, some participants reported that they localise the direct sound roughly where the loudspeaker is, but the reverberation is perceived in the head.
SR2 was described as sounding good and natural. However, the audiovisual alignment with the visible loudspeaker was often criticized, with the auditory source image being “blurry” or “fuzzy”. Some localized the source behind the loudspeaker, while others spoke of in-the-head localization. It was apparent to most subjects that the room sounded very different.
For the test cases Orig, Orig_early, RT_0.2, RT_0.4, some participants asked whether the real loudspeaker is playing, or mentioned that they find it convincing. With increasing RT, the subjects commented increasingly on the reverberation and especially for the longest tails, for example, “Oh, that is very reverberant”.
The following section presents the ratings and the corresponding statistical considerations.
5.4.2 Ratings and statistical analyses
Figure 5 displays boxplots of the ratings from the listening experiments grouped by room acoustic condition and rated attribute. Friedman’s tests were conducted to check for differences between the sample groups at a significance level α = 0.05. The data from the different room acoustic conditions were pooled across signal types. In the following, all room acoustic conditions are compared against the reference condition, Orig. Results from the Friedman’s tests indicate differences between the conditions amongst all attributes (p < 0.001). Hence, Wilcoxon signed-rank tests with Bonferroni-Holm correction were used to check for differences between the reference data set and room acoustic conditions with α = 0.05. The reported values include the median (Mdn), corrected p-values, and Z-scores.
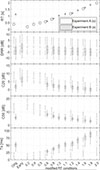 |
Figure 5. Results from the listening test of Experiment A for the five questions. The results are pooled over the three signal conditions. The asterix denotes conditions showing a statistically significant difference from the reference room acoustic condition Orig after Bonferroni-Holm correction. |
The ratings for Q.I (externalization) reveal significant differences for the modified conditions RT_1.2 (Mdn = 6, p < 0.001, Z = 4.2), RT_1.6 (Mdn = 5, p < 0.001, Z = 4.5), and RT_2.0 (Mdn = 5, p < 0.001, Z = 5.2). Regarding conditions that served as anchors, Mono_0.4 (Mdn = 6, p = 0.056, Z = 2.6), Mono_0.8 (Mdn = 4, p < 0.001, Z = 5.6), and Anchor (Mdn = 1, p < 0.001, Z = 6.8) show significantly lower ratings for Q.I, as expected.
In contrast, Orig_early (Mdn = 6, p = 0.056, Z = 2.6) was rated without a significant difference to the reference condition. Also, room condition SR2 (Mdn = 5, p < 0.001, Z = 4.3) was rated significantly lower. In contrast, no significant difference was found for Orig_early (Mdn = 6, p = 0.056, Z = 2.6).
The ratings for Q.II (impression that the loudspeaker is playing) show significantly lower scores for modified conditions RT_0.8 (Mdn = 5, p = 0.0026, Z = 3.5), RT_1.2 (Mdn = 5, p < 0.001, Z = 5.3), RT_1.6 (Mdn = 4, p < 0.001, Z = 5.6) and RT_2.0 (Mdn = 4, p < 0.001, Z = 5.4). Different from the scores for Q.I, all anchor conditions are rated significantly lower.
Regarding Q.III (sounds like original room), only RT_0.2 Mdn = 5, p = 0.14, Z = 1.8) and RT_0.4 (Mdn = 5, p = 0.63, Z = 0.48) were not rated significantly different from the reference. The ratings for all other conditions were identified as significantly different with p = 0.044 or lower.
The scores for Q.IV (integration into the room) follow a trend similar to the scores for Q.III. The post hoc analysis did not reveal significant differences in the ratings when comparing RT_0.2 (Mdn = 5, p = 0.35, Z = 1.4) and RT_0.4 (Mdn = 5, p = 0.35, Z = 1.4) to the reference.
Q.V (do you like it?), addressing the listener’s preference, yielded the highest scores for RT_0.2 (Mdn = 5, p = 0.65, Z = 0.99), RT_0.4 (Mdn = 5, p = 0.65, Z = −0.52), and RT_0.5 (Mdn = 5, p = 0.11, Z = 2.1) showing no significant difference. All remaining conditions are rated differently from the measured BRIRs (p < 0.03).
Additionally, RT_0.4, which synthesized the original RT, was tested for equivalence with the reference in all attributes using a Two one-sided test (TOST) with an equivalence interval of Δ = ±0.5. The distributions were found to be equivalent for all five attributes (p < 0.001).
An analysis of the three signal conditions using Wilcoxon signed-rank tests with Bonferroni-Holm correction did not indicate a significant impact of the signal type (p > 0.05) or the real side loudspeaker reproducing drums.
Correlations were calculated using Spearman’s rank correlation coefficient. Figure 6 shows the resulting correlation matrix. The attributes are generally moderately to highly correlated. Notably, high correlations were observed for Q.I and Q.II (0.75), as well as Q.III, Q.IV, and Q.V, with values between 0.82 and 0.91.
 |
Figure 6. Mean Spearman’s rho correlation values between the attributes. Q.I to Q.V indicate the questions introduced in Table 1. |
5.5 Discussion of Experiment A
This section will discuss the results of this experiment individually for each attribute.
5.5.1 Externalization (Q.I)
The ratings show that externalization is robust for RT’s in the range from 0.2 s to 0.8 s, which corresponds to deviation from 50% to 200% of the original RT. Even Orig_early, despite its entire lack of a late reverb tail, shows no significant differences. The Anchor shows the worst externalization, which was expected due to the lack of any room acoustic information [53]. Orig_early differs from the Anchor by preserving the original early reflections, which seem essential for externalization.
Externalization degrades for RT deviations greater than 0.8 s (200% of original RT). In addition, with increasing RT deviation, broadening distributions also suggest that consensus among the participants drops. Conditions Mono_0.4 and, especially, Mono_0.8 evoke reportedly two perceptually distinct impressions of externalization, which explains the broad distribution for both items. Similarly, ambivalent ratings are observed for SR2. These measured BRIRs provide natural reverberation cues that are contradictory to the original room, which can cause uncertainty in how participants rate externalization. However, the BRIRs exhibit an RT = 1.1 s and the externalization ratings with a median of five, align well with the artificial modifications of RT.
5.5.2 Audiovisual source plausibility – Impression of a playing loudspeaker (Q.II)
Q.II assessed audiovisual plausibility by asking whether the participant had the impression that the loudspeaker reproduced the sound they were hearing. Creating the plausible illusion that a loudspeaker is playing the sounds demands sufficient perceived congruence between auditory (binaural reproduction) and visual cues (real visible loudspeaker). As a consequence, we will refer to Q.II as Audiovisual Source Plausibility (AVSP).
All conditions with an RT of 0.8 s and higher, as well as the Anchor and Mono_0.4, show a significant difference from the reference. Potential audiovisual misalignment between the virtual sound source and the visible loudspeaker can often be related to a deviating distance perception due to differences in the DRR [53, 54]. However, DRR deviations are below 3 dB for all conditions containing reverb, which is near the reported JNDs [55].
In general, ratings for Q.II are highly correlated (0.75, see Fig. 6) with the ratings for externalization. Externalization is a fundamental requirement for AVSP and therefore influences its results.
5.5.3 Room acoustic signature preservation – Sounds like original room (Q.III)
The third question aimed to assess whether the modification in the acoustics is perceived as different from the original room or still acknowledged as the original room acoustics. We have reviewed numerous studies on the perceptual matching of room acoustics [32], but did not find a perceptual attribute that addresses this question. Therefore, we introduce the attribute of Room Acoustic Signature Preservation (RASP) in the following.
The synthesized version of the original RT (RT_0.4) was shown to be equivalent to the reference. This highlights the suitability of the implemented RT modification method.
For all longer modified late reverberation tails, the participants rated RASP lower. Already, the small change from RT = 0.4 to RT = 0.5 made a difference for this attribute. Shorter reverberation times do not seem to be as critical in this rather dry room. RT_0.2 did not show significant differences, and Orig_early, although yielding a significant difference, was rated with the same Mdn = 5.
The results of this experiment do not provide insight into whether tonal or timbral features play a role in assessing RASP. The algorithm aims to preserve the timbral properties of the original room. SR2 is the only test condition that yields a different spectral profile. However, due to its diverging reverberation time, significant differences are already expected.
5.5.4 Audiovisual room plausibility (Q.IV)
Q.IV assess whether the virtual room acoustic condition integrates well into the environment despite divergences in the late reverberant field. We designed this question with the intention of testing the degree to which the test item meets the listener’s expectations that are raised by the natural environment towards room acoustics and its decay behavior. Therefore, we introduce the attribute of Audiovisual Room Plausibility (AVRP) in order to distinguish this plausibility measure from Q.II .
The plausibility of the auralized room drops significantly with increasing reverberation time, beginning already at an RT increase of 100 ms. This is different to the AVSP, which showed its first significant impact at an RT increase of 400 ms (200% original RT).
Initially, it was expected that Q.IV would be less sensitive than Q.III. This could not be observed from the results of this experiment, as the same conditions exhibited significant differences for both attributes. The correlation between both attributes was very high (91%). For the tested conditions in this dry environment, it seems to affect the room plausibility, if the room does not sound like the original. In contrast, the source plausibility was more resilient.
5.5.5 Do you like it? (Q.V)
Question Q.V was included to assess the individual preference of the listeners. The ratings for Q.V show a high correlation with the ratings of Q.III (ρ = 0.82) and Q.IV (ρ = 0.85). For conditions RT_0.8 and RT_1.2, the whiskers of the boxplots span the whole scale. This suggests that the listeners’ aesthetic preference is highly individual.
Initially, it was speculated that the type of signal might influence the preference. Speech intelligibility can suffer significantly in highly reverberant conditions, whereas music-related content is often associated with reverb as a sound design effect. However, the current results do not reveal a significant influence of the signal type on these results.
6 Experiment B – Reverberant room
This section describes the experiment conducted in a seminar room at TU Ilmenau (SR2). It has a shoebox shape with the dimensions 9.9 m × 4.7 m × 3.1 m (length × width × height), a total surface area of about 184 m2, a volume of 144.2 m3, and an average reverberation time (RT = T30) of about 1.09 s.
Table 6 displays RT values estimated for different octave bands. The room exhibits approximately 2.75 times the RT (mid-bands) of the room from Experiment A.
Frequency-dependent RT, estimated from a measured RIR in different octave bands.
6.1 Measurement of BRIR data set
The BRIRs were measured with a KEMAR 45BA HATS placed on an Outline electric turntable at nine equally-spaced (0.25 m) listening positions along the 2 m long line (see Fig. 2). A Genelec 1030A monitor was used as a sound source and placed at a distance of 1.25 m in front of the closest listening position. A second loudspeaker was placed 1.25 m to the right of the third position.
Horizontal orientations were sampled in 4°-steps for each of the nine measurement positions. The difference in horizontal resolution compared to Experiment A (2.5°) resulted from the use of a different electric turntable at this experiment’s location. The ears of the HATS and the acoustic center of the loudspeakers were placed at 1.59 m above the floor. An exponential sine sweep ranging from 50 Hz to 22 kHz over a duration of 3 s, followed by a 2 s pause, served as the excitation signal for the measurement. The measured BRIRs were published as part of a larger data set [56].
6.2 Test items
Seven BRIR data sets with synthetic late reverberation tails were created using the approach described in Section 3 with reverberation times increasing in 0.2 s steps from 0.6 s to 1.8 s (RT_0.6 to RT_1.8). Condition RT_1.1 is the synthesized condition with original RT. Table 7 shows an overview of the different conditions. Additionally, Table 8 presents changes in acoustic parameters induced by the algorithm for the left ear at a single measurement position (center of the line). The anchor conditions were chosen in accordance to Experiment A. Hence, condition Anchor only includes the direct sound of the BRIRs and Orig_early the early BRIR segments, including up to 50 ms after the direct sound. In contrast to Experiment A, only one condition with a monaural reverberant tail (Mono_1.1) was included. Finally, the measured data set from Experiment A (SR1) was also included as a test item.
Overview of the BRIR data sets items used in the listening experiment.
Comparison of room acoustic parameters for Experiment B. The values were estimated from BRIRs with a distance of 2.25 m from the frontal loudspeaker and 0° orientation. RT (T30), DRR, C20, C50, and ts show the values for the left channel only.
6.3 Participants
A total of 19 subjects (16 males, 3 females) participated in the listening test. The average of the participant group is 31.5 years, ranging from 22 to 43. Eleven participants were considered experienced listeners due to their prior participation in multiple listening experiments or work in the related research area.
6.4 Results
Before analyzing and discussing the ratings, this section documents comments and statements given by participants during the experiment.
6.4.1 Participant comments and verbal descriptions
The participants in this experiment mainly commented on test items with the most diverging room acoustic conditions. RT_1.6 and RT_1.8 were associated with a large hall or described as sounding like a church. RT_0.6 and Orig_early were perceived as closer than real loudspeaker. Most questions were asked on condition Mono_1.1. The combination of an externalized sound source with an in-head localization of the reverberant tail confused some participants, especially regarding the rating of externalization. In the case of condition Anchor, participants made similar comments on the unsuitability of this condition as in Experiment A.
6.4.2 Ratings and statistical analyses
Figure 7 shows the results of Experiment B. The scores from the experiment are analyzed for all five questions using Friedman’s test to check for potential differences between the reverberation conditions, excluding the conditions Anchor, Orig_early, and Mono_1.1. The outputs from the Friedman’s tests indicate that the room acoustic condition affects the ratings in all tested attributes (p < 0.001).
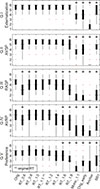 |
Figure 7. Listening test results for five attributes (Q.I – Q.V) in Experiment B. The asterisk above a boxplot denotes a condition with a significant difference from the ratings of the reference condition Orig after Bonferroni-Holm correction. Ratings were given consecutively for every item. |
Pairwise comparisons were conducted using the Wilcoxon signed-rank test with Bonferroni-Holm correction. All room acoustic conditions were compared against the condition Orig, which served as the reference.
For Q.I (externalization), conditions Anchor (Mdn = 1, p < 0.001, Z = 6.6), Orig_early (Mdn = 4, p < 0.001, Z = 5.7), Mono_1.1 (Mdn = 4, p < 0.001, Z = 6.2), and SR1 (Mdn = 4, p < 0.001, Z = 5.2) were found to be rated significantly lower than the reference Orig.
Conditions with modified RTs were not rated significantly different from the reference, with all conditions having the same median (Mdn = 6, p > 0.15).
Q.II (impression that the loudspeaker is playing) was rated lower for conditions Anchor (Mdn = 1, p < 0.001, Z = 6.6), Orig_early (Mdn = 4, p < 0.001, Z = 5.6), Mono_1.1 (Mdn = 4, p < 0.001, Z = 6), SR1 (Mdn = 4, p < 0.001, Z = 4.4), and RT_1.8 (Mdn = 6, p < 0.001, Z = 4).
Q.III (sounds like original room) showed significantly lower scores for the modified conditions with RT < = 1.0 s which includes RT_0.6 (Mdn = 3, p < 0.001, Z = 5.1), RT_0.8 (Mdn = 4, p < 0.001, Z = 4). Conditions with RT> 1.4 s were also found to be rated lower including RT_1.4 (Mdn = 4, p = 0.05, Z = 2.4), RT_1.6 (Mdn = 4, p < 0.001, Z = 4.6) and RT_1.8 (Mdn = 3, p < 0.001, Z = 5).
The ratings for Q.IV (integration into the room) show a significantly lower median for the modified conditions RT_0.6 (Mdn = 4, p < 0.001, Z = 3.8), RT_1.6 (Mdn = 4, p = 0.0015, Z = 3.7), and RT_1.8 (Mdn = 4, p < 0.001, Z = 4.8). As expected, the remaining conditions Anchor, Orig_early, Mono_1.1 and SR1 also produced lower scores.
Regarding Q.V (do you like it?), differences were observed for the modified RT_1.6 (Mdn = 4, p < 0.001, Z = 4) and RT_1.8 (Mdn = 3, p < 0.001, Z = 4.9). Similarly to the questions discussed above, conditions Anchor, Orig_early, Mono_1.1, and SR1 were also rated lower than condition Orig.
Scores of the synthesized condition without modification RT_1.1 were checked for equivalence against the reference (TOST, Δ = ±0.5). Scores for Q.I (p < 0.001), Q.II (p < 0.001), Q.IV (p = 0.04), and Q.V (p < 0.001) were found to be equivalent. The test result was inconclusive for Q.III (p = 0.1).
The signal type or the addition real loudspeaker reproduction did not show any significant effect on the ratings.
Figure 8 shows the mean Spearman’s rho correlation values for the five attributes. Overall, the attributes show a medium to high correlation with one another. Highest correlations can be observed for Q.III and Q.IV (ρ = 0.83), as well as Q.IV and Q.V (ρ = 0.79).
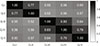 |
Figure 8. Spearman’s rho correlation values between the attributes. Q.I to Q.V indicate the questions introduced in Table 1. |
6.5 Discussion of Experiment B
This section discusses the results from Experiment B for the individual attributes.
6.5.1 Externalization (Q.I)
Experiment B was conducted in a room that can be considered quite reverberant. Modifying the decay time of the late reverberation tail in the examined ranges did not affect externalization. It was expected that lowering RT would at least impact the ratings for Q.I. However, externalization remained robust. Orig_early, with the late reverb being removed entirely, was the only “drier” condition based on the measured dataset that showed a significant impact on the ratings. Removing the late reverberation from the original measurement Orig_early affected the externalisation significantly. Furthermore, SR1 (RT = 0.4 s) was the only other comparably dry condition with an RT lower than RT_0.6. It was also significantly impacted in Q.I. However, we cannot determine whether this effect is due to the low RT, the mismatch in the early reflections, or both.
Condition Mono_1.1 was also rated significantly lower by the participants. Like in Experiment A, participants frequently mentioned this condition, describing it as confusing, with an externalized sound image accompanied by in-head localization of the reverberation. This may explain why most of the scores are concentrated around the center of the scale.
6.5.2 Audiovisual source plausibility (Q.II)
The ratings for Q.II show a similar robustness to the RT modifications as externalization. RT_1.8 is the only modified RT condition that showed a statistically significant drop in Q.II ratings. Some participants reported problems with distance perception, localizing the virtual sound source slightly farther away than the real loudspeaker. Similarly, conditions with low RTs were reported to be perceived closer than the visible loudspeaker. This explains the degraded ratings of Orig_early, Anchor, and SR1. RT_0.6 may be considered an edge case in this regard.
Generally, the results suggest that modifying RT in the provided ranges with the implemented modification method still provides an externalized sound image and a convincing illusion of the playing loudspeaker.
6.5.3 Room acoustic signature preservation (Q.III)
The statistical analysis for Q.III indicates that participants tend to be able to discern the late reverb mismatches between the different conditions and the original room. For conditions RT_1.1 and RT_1.2, no statistical difference was observed. Conditions with RTs higher than 1.2 s or lower than 1.1 s were already significantly affected in RASP. This indicates that participants began to notice the deviation from the original room acoustics. However, rating this attribute was challenging, as even participants with experience in this field reported. This likely explains the broad distribution of scores for the majority of the modified conditions.
Overall, it can be noted that listeners can sense small deviations from the original RT in this reverberant room.
6.5.4 Audiovisual room plausibility (Q.IV)
Overall, the statistical analysis revealed a high correlation between the scores for Q.III and Q.IV (ρ = 0.8). Conditions that were perceived to sound like the original room were generally rated higher in AVRP. However, in comparison to Q.III, the ratings of Q.IV, which we interpret as AVRP, indicate a higher tolerance to the RT deviations. A significant decrease was observed when RT was reduced by 45%, whereas Q.III was already impacted at a decrease of 10%. In the case of longer RT, Q.IV was affected, starting from a 45% increase in RT, compared to Q.III at 27%.
Also, for this question, the participants reported that rating this question was challenging. This may explain the broad distributions, especially in conditions where RT deviations are clearly noticeable, like RT_0.6 or RT_1.6. Even the measured reference condition Orig was sometimes rated with scores on the lower half of the scale.
Compared to AVSP, the ratings indicate a higher sensitivity of AVRP to changes in RT. The illusion that the loudspeaker is reproducing the sounds seems to be more robust to RT deviations.
6.5.5 Preference (Q.V)
Similar to the findings of Experiment A, the participants’ preference shows the highest correlation with AVRP. The statistical analysis reveals that ratings begin to decline significantly for conditions with RT ≥ 1.6 s. Modifications aimed at reducing RT were not found to impact the ratings, with medians ranging from 4 to 5. Yet, the reference Orig also exhibited a median of only 5 in this test.
Initially, it was expected that preferences might differ for the different stimuli. However, in this experiment, the type of signal (music or speech) was not found to have a significant influence on the scores. The wide range of scores for conditions with high RT (RT_1.4, RT_1.6, RT_1.8) suggests that individual preferences diverge for RT enhancement. The question remains whether a more specific context that justifies RT deviations can lead to a higher degree of acceptance or preference.
7 Discussion
The synthesized BRIRs with the original RT were perceived as equivalent to the original measurements. This underlines the validity of the modification algorithm. In Experiment A, all test questions were rated equivalently, and in Experiment B, four of five questions. Only for Q.III in B, the TOST-analysis (Δ = ±0.5, half Likert-unit) did not indicate statistically significant equivalence. However, the median is equivalent between the measured reference and its synthesized counterpart. The ratings for Q.III show generally high uncertainty. More participants would be needed to make a clear conclusion. We still conclude that the implemented method was suitable for this investigation.
In the following, the two experiments will be compared, and the test methodology will be discussed. Furthermore, the relation between room acoustic parameters and the perception will be analyzed. Finally, the limitations of this study will be assessed.
7.1 Comparison of Experiments A and B – role of original RT
One of the main differences between Experiments A and B is the reverberation time of the tested rooms. The room in Experiment A was already quite dry. Decreasing the decay time further did not yield any strong perceivable differences. Even when removing the late reverb tail entirely, medians similar to the reference are observed. The room in Experiment B had a longer original reverberation time and allowed for stronger modification towards lower decay times. With only a slight decrease (RT = 1.0, 91% of the original RT), RASP is already significantly affected. With further decrease (RT = 0.6 s, 55% of original RT), also AVRP is impacted. The other attributes show robustness towards this change. Removing the late reverberation fundamentally destroyed plausibility.
On the other hand, for increasing RT beyond the original value, the limits were chosen to be 2.0 s and 1.8 s, corresponding to a 400% and 64% increase of the original RT for Experiments A and B, respectively. The severe increase in RT for Experiment A showed degradations in the ratings for externalization and AVSP when RT was scaled by more than 200%. In contrast, both of these attributes were nearly unaffected in Experiment B. Only the highest RT scaling was an exception, with an impacted AVSP. The association with real acoustics of the room (RASP) was impacted in both rooms when RT increased by a comparable relative amount of 25% (A), and 27% (B), respectively. Similarly, preference was impacted in both experiments when RT exceeded about 45% (A) and 50% (B).
Regarding the anchor conditions, it was found that Anchor was rated worst in both rooms in all five attributes. As stated above, the lack of any room acoustic information has a severe impact on externalization and consequently affects AVSP.
The ratings and reports on conditions with monaural late reverberation also exhibited similar effects in both rooms. The clear perceptual distinction between the spatial early response, combined with in-head localization, for Mono_0.8 and Mono_1.1 reverb tails, especially affected the ratings in RASP and AVSP.
In both experiments, the measured data sets of the other room were also considered as test conditions. These conditions not only show a clear difference in RT, but also exhibit an early reflection pattern that does not match the room in which they were used for auralization. Furthermore, both rooms have diverging spectral characteristics.
Werner et al. [13] auralized a dry listening lab (RT = 0.27 s) and a very reverberant empty seminar room (RT = 2.0 s) in the other room and observed a degradation of externalization. Here, the difference between the two rooms is smaller in terms of RT (0.4 s and 1.0 s). However, both rooms produce degraded ratings for all the tested attributes when auralized in the other room. In Experiment B, all conditions with scaled RT and original early reflection patterns did not show significant differences in externalization, but SR1 was even drier than RT_0.6. Therefore, we cannot draw conclusions from the data if the difference in RT or the difference in the early reflection pattern or both cause the effect. In Experiment A, SR2 shows ratings that are similar to scaled RTs in the same range. Further investigation is necessary.
7.2 The introduction of RASP and AVRP
For the interpretation of the psychoacoustic results, we introduced a differentiation between source- and room-related plausibility. We assessed the rank-based Spearman’s correlation and found 0.63 and 0.6 between AVSP (Q.II) and AVRP (Q.IV). This indicates that the two attributes are not entirely orthogonal, but also not redundant.
The results from this experiment confirm that the RT modifications had less influence on the illusion that the loudspeaker is playing (AVSP) than on the impression that the perceived reverberation integrates well into the actual environment (AVRP). The trend was observed in both Experiments A and B.
Preference was found to correlate slightly more with the ratings for AVRP (ρ = 0.85 in Experiment A, ρ = 0.79 in Experiment B) than AVSP (ρ = 0.65, ρ = 0.57).
Interestingly, Teng et al. [57] provided the first evidence for robust separate representations of the auditory source and the reverberant space in the human brain. We see a potential link to the observation of our study and the different ratings with regard to source and room. The differences and relations in the perception of source and room should be explored in more depth for AR systems in the future.
Furthermore, Q.I and Q.II show a high correlation in both experiments. Externalization is a known key element of audiovisual plausibility. As a consequence, a high correlation can be expected. High AVSP requires high externalization. However, externalization does not necessarily require good AVSP.
Including Q.III (RASP) as an additional question allowed assessing if the participants acknowledged the reverberation to sound like the original room or noticed a deviation in the acoustic properties. Of course, if the reverberation sounds like the original room, the room plausibility (Q.IV) was high as well. This leads to the high correlations (ρ = 0.91) in Experiment A and (ρ = 0.83) in Experiment B. While in Experiment A, the two attributes seems redundant, in the more reverberant room in Experiment B, RASP represents a stricter quality criterion than AVRP. Already at very small deviations of the scaled RT from the real room, RASP shows significant effects in contrast to all other attributes. This underlines the potential and value of this attribute.
7.3 Does the presence of a real sound source make a difference?
In both experiments, the third test block introduced a real loudspeaker as a second sound source, playing concurrently over the binaural auralizations. The presence of a real sound source usually serves as a reference regarding the room acoustic impression and allows the listener to compare the virtual and real sound reproduction, which influences the plausibility of the virtual source [52]. In contrast to the participant and experimenter, who represent real sound sources, the loudspeaker reproduced a continuous signal.
Our test results do not reveal an influence of the real loudspeaker on the perception of the virtual source in both experiments. Thus, adding this real source did not further tune the internal reference of the listeners. On the contrary, several participants mentioned that it makes rating more difficult.
7.4 Relation between room acoustic parameters and perception
Table 4 reported the room acoustic parameters for Experiment A, and Table 8 for Experiment B. The parameters were estimated for the left channel of the BRIR for an azimuth of 0° at the center position of the line. It is evident that the RT changes according to the desired scaling. The relation to the perceptual results has been discussed with respect to both experiments.
The DRR, however, changes only slightly within a 2 dB range, which is below the known JNDs [55]. Therefore, the DRR cannot explain the significant differences in the ratings. This is particularly interesting, since several participants reported perceiving the source image at a distance different from the loudspeaker position. Distance perception is typically related to the DRR. However, different effects seem to be responsible for this observation.
IACCE remains constant because the early part remains constant. IACCL is very low in the measured data and changes only minimally with the scalings, and therefore, cannot explain the differences.
The C50 value is interesting, because the implementation considered a mixing time of 50 ms. Thus, until 50 ms after the direct sound, the BRIRs remained unchanged throughout the different scalings. All the variation in the C50 values for the various scalings is due to the change in the late reverberation. The C20 and center time ts values were calculated in addition, because with speech in small rooms, they seem to be more closely related to perception, as discussed in [14].
Figure 4 shows the distribution of the estimated parameters and their changes across the different RT scalings. A correlation analysis between the physical parameter changes and the ratings did not show clear trends. Further studies are required to better understand the relation between the physical parameters and perception.
7.5 Limitations and future work
It is important to note that in both experiments, the modification of the BRIRs leads to room responses that are not physically correct. Changing the room’s decay behavior after the early reflections impacts the natural progression of the evolving sound field. It is unclear, if this affects the perception.
Additionally, the resulting reverberation tails from the modification step may vary depending on the mixing time estimate and produce different perceptual results. This has not been investigated in this context, as only one mixing time value was chosen per room. Also, changes in room acoustic parameters, e.g. DRR, due to the RT modification are observed to be in the range of reported JNDs. However, it is not yet fully understood if several changes in room acoustic parameters can still produce audible differences despite being below the respective JNDs. Initial evidence suggests that such cumulative effects may occur [58], but broader validation is still lacking.
In both experiments, a loudspeaker was used as a sound source for both real and virtual presentations. Choosing a loudspeaker as a source might make the tolerance range larger, because we know that loudspeakers can produce various signals. For a speaking or singing person or an acoustic instrument being the source, we might have more distinct expectations and might be more sensitive to deviations.
Perceptual tolerances with regard to absolute RT deviations depend on the reverberation time of the room. Future studies across a broader range of room acoustic conditions could reveal whether similar trends apply beyond the two rooms tested here.
Furthermore, this presented study examined only one method for modifying the reverberation of measured BRIRs. Future work could explore alternative methods.
We chose to scale the decay for all frequency bands by the same scaling factor for a specific target RT. However, modifying each frequency band by an individual scaling factor could be useful, for example, to allow for morphing between two rooms. This was out of the scope of the present investigation.
In this study, we ask “Do you like it?” to assess preference. More sophisticated evaluation methods for assessing how listeners perceive the balance between acoustic realism and subjective preference are of interest. Moreover, the relation between source plausibility, room plausibility, and room acoustic signature preservation needs better understanding and the development of an established test method. This is particularly relevant with regard to modifying the appearance of the user’s real environment, which could be interesting for artistic purposes or specific target AR/XR applications. For instance, one could visually remove a real wall and seamlessly extend the space with a virtual room, requiring the acoustics to adapt accordingly for a coherent experience.
Moreover, the presented experiments did not provide a specific practical context or application in which these modifications were justified, other than for psychoacoustic examination. However, when a modified virtual room acoustic presentation is used in specific contexts, such as musical performances, artistic acoustic experiments, or cocktail party scenarios, these contexts may also shape the listener’s expectations.
8 Conclusion
This article presents two experiments investigating the perceptual tolerances associated with reverberation time in Augmented Reality scenarios in two different rooms. Experiment A was conducted in a comparably dry room with RT ≈ 0.4 s (mid-frequency), and Experiment B in a reverberant seminar room with RT ≈ 1.1 s. In a Multi-Attribute Absolute Category Rating questionnaire, both experiments assessed externalization, plausibility, and preference attributes.
For the interpretation of the results, we introduced the differentiation between Audiovisual Source Plausibility (AVSP) and Audiovisual Room Plausibility (AVRP) based on the theoretical concept of audiovisual interactions in AR introduced in [4]. In addition, the concept of Room Acoustic Signature Preservation (RASP) was introduced to distinguish virtual reverberation that is perceived in agreement with the specific acoustic characteristics of the room from more generic reverberation that still makes sense for the given room.
For externalization, only large differences in RT were critical, while keeping the original early part of the BRIR. Within the test cases, only RTs> 1.2 s in the dry seminar room caused significant differences.
Also, AVSP remained robust to small deviations in RT, but degraded for large RT deviations of 0.4 s and 0.7 s for the dry and reverberant rooms, respectively. This underlines that high AVSP requires high externalization, but not vice versa.
As expected, RASP showed a high correlation with AVRP. However, in the reverberant seminar room, it is considerably more sensitive to already very small changes in RT, starting from a difference of 0.1 s. Despite this high sensitivity to deviations from the original room acoustics, the illusion of the loudspeaker producing sound was still possible beyond this change.
Furthermore, the ratings related to liking and preference showed the highest correlation with AVRP. Thus, a sensible alignment of visual and auditory room perception is more important for the creation of enjoyable AR experiences than an exact recreation of the original room acoustics.
Acknowledgments
The authors would like to thank Boyd Thwaite for his help and all participants for their interest and support.
Funding
Christian Schneiderwind’s contribution to this study was funded by Carl-Zeiss-Stiftung under the project: “Co-Presence of Humans and Interactive Companions for Seniors (CO-HUMANICS)”. Annika Neidhardt’s and Enzo De Sena’s contribution was funded by the Engineering and Physical Sciences Research Council (EPSRC) under the “SCalable Room Acoustics Modelling (SCReAM)” grant EP/V002554/1 and “Challenges in Immersive Audio Technology (CIAT)” grant EP/X032914/1.
Conflicts of interest
The authors declare no conflict of interest.
Data availability statement
The measurement data set from Experiment B is available in Zenodo, under the reference [56]. All data sets and results are available on request from the authors.
Author contribution statement
Christian Schneiderwind and Annika Neidhardt designed and conducted the study. Enzo De Sena provided valuable contributions to the overall scope and discussion, the statistical analysis and editing of the article.
References
- J. Skowronek, A. Raake, G.H. Berndtsson, O.S. Rummukainen, P. Usai, Simon, N.B. Gunkel, M. Johanson, E.A.P. Habets, L. Malfait, D. Lindero, A. Toet: Quality of experience in telemeetings and videoconferencing: a comprehensive survey. IEEE Access 10 (2022) 63885–63931. [CrossRef] [Google Scholar]
- C. Kuhn-Rahloff: Realitätstreue, Natürlichkeit, Plausibilität: Perzeptive Beurteilungen in der Elektroakustik. Ph.D. thesis, TU Berlin, Germany, 2012. [Google Scholar]
- A. Lindau, S. Weinzierl: Assessing the plausibility of virtual acoustic environments. Acta Acustica united with Acustica 98, 5 (2012) 804–810. [CrossRef] [Google Scholar]
- A. Neidhardt, C. Schneiderwind, F. Klein: Perceptual matching of room acoustics for auditory augmented reality in small rooms – literature review and theoretical framework. Trends in Hearing 26, January 2022. [Google Scholar]
- N. Meyer-Kahlen, S. Schlecht, S.V. Amengual Garí, T. Lokki: Testing auditory illusions in augmented reality: plausibility, transfer-plausibility, and authenticity. Journal of the Audio Engineering Society 72, 11 (2024) 797–812. [Google Scholar]
- C. Schneiderwind, A. Neidhardt: Discriminability of concurrent virtual and real sound sources in an augmented audio scenario, in: 152nd AES Convention, paper 10604, The Hague, The Netherlands/Online, 2022. [Google Scholar]
- A. Neidhardt, A.M. Zerlik: The availability of a real hidden reference affects the plausibility of position-dynamic auditory AR. Frontiers in VR, 2021. [Google Scholar]
- S.A. Wirler, N. Meyer-Kahlen, S.J. Schlecht: Towards transfer-plausibility for evaluating mixed reality audio in complex scenes, in: Audio Engineering Society Conference: 2020 AES International Conference on Audio for Virtual and Augmented Reality. Audio Engineering Society, 2020. [Google Scholar]
- F. Immohr, G. Rendle, A. Lammert, A. Neidhardt, V.B. Heyde, A. Raake: Evaluating the effect of binaural auralization on audiovisual plausibility and communication behavior in virtual reality, in: 2024 IEEE Conference Virtual Reality and 3D User Interfaces (VR), 2024. [Google Scholar]
- F. Immohr, G. Rendle, C. Kehling, A. Lammert, S. Göring, B. Froehlich, M. Walessa: Subjective evaluation of the impact of spatial audio on triadic communication in virtual reality, in: 2024 16th International Conference on Quality of Multimedia Experience (QoMEX), 2024, pp. 262–265. [Google Scholar]
- S.A. Arboleda, C. Kunert, J. Hartbrich, C. Schneiderwind, C. Diao, C. Gerhardt, T. Surdu, F. Weidner, W. Broll, S. Werner, A. Raake: Beyond looks: a study on agent movement and audiovisual spatial coherence in augmented reality, in: 2024 IEEE Conference Virtual Reality and 3D User Interfaces (VR). IEEE Computer Society, Los Alamitos, CA, USA, March 2024, pp. 502–512. [Google Scholar]
- M. Slater: Place illusion and plausibility can lead to realistic behaviour in immersive virtual environments. Philosophical transactions of the Royal Society of London. Series B, Biological Sciences 364 (2009) 3549–3557. [Google Scholar]
- S. Werner, F. Klein, T. Mayenfels, K. Brandenburg: A summary on acoustic room divergence and its effect on externalization of auditory events, in: 2016 Eighth International Conference on Quality of Multimedia Experience (QoMEX). IEEE, Lisbon, Portugal, June 2016 pp. 1–6. DOI: https://doi.org/10.1109/QoMEX.2016.7498973. [Google Scholar]
- A. Neidhardt: On the plausibility of simplified acoustic room representations for listener translation in dynamic binaural auralizations. Ph.D. thesis, Technische Universität Ilmenau, Ilmenau, Oct 2023. [Google Scholar]
- C. Wang, M. Jia, M. Li, C. Bao, W. Jin: SS-BRPE: Self-supervised blind room parameter estimation using attention mechanisms, in: ICASSP 2025 – 2025 IEEE International Conference on Acoustics, Speech and Signal Processing (ICASSP), 2025, pp. 1–5. [Google Scholar]
- T. Deppisch, N. Meyer-Kahlen, S.V.A. Garí: Blind identification of binaural room impulse responses from smart glasses. IEEE/ACM Transactions on Audio, Speech, and Language Processing 32 (2024) 4052–4065. [Google Scholar]
- C.J. Steinmetz, V.K. Ithapu, P. Calamia: Filtered noise shaping for time domain room impulse response estimation from reverberant speech, in: 2021 IEEE Workshop on Applications of Signal Processing to Audio and Acoustics (WASPAA), 2021, pp. 221–225. [Google Scholar]
- R. Gupta, J. He, R. Ranjan, W.S. Gan, F. Klein, C. Schneiderwind, A. Neidhardt, K. Brandenburg, V. Välimäki: Augmented/mixed reality audio for hearables: sensing, control, and rendering. IEEE Signal Processing Magazine 39, 3 (2022) 63–89. [Google Scholar]
- K. Godin, H. Gamper, N. Raghuvanshi: Aesthetic modification of room impulse responses for interactive auralization, in: AES International Conference on Immersive and Interactive Audio, 2019. [Google Scholar]
- A. Neidhardt: Effect of impaired early reflection patterns on plausibility and similarity of position-dynamic binaural ar audio. Submitted, 2025. [Google Scholar]
- A. Neidhardt, S. Kamandi: Plausibility of an approaching motion towards a virtual sound source II: in a reverberant seminar room, in: 152nd AES Convention, The Hague, The Netherlands, 2022. [Google Scholar]
- A. Neidhardt, A. Ignatious-Tommy, A.D. Pereppadan: Plausibility of an interactive approaching motion towards a virtual sound source based on simplified BRIR sets, in: 144th AES Convention, Milan, Italy, 2018. [Google Scholar]
- M. Gospodarek: Acoustic and perceptual factors affecting plausibility in sound design for audio augmented reality experiences. Ph.D. thesis, New York University, NY, USA, 2024. [Google Scholar]
- H.-P. Seraphim: Untersuchungen über die unterschiedsschwelle exponentiellen abklingens von rauschbandimpulsen. Acta Acustica united with Acustica 8, 4 (1958) 280–284. [Google Scholar]
- M. Karjalainen, H. Jarvelainen: More about this reverberation science: perceptually good late reverberation, in: 111th Convention of the Audio Engineering Society, 2001. [Google Scholar]
- Z. Meng, F. Zhao, M. He: The just noticeable difference of noise length and reverberation perception, in: 2006 International Symposium on Communications and Information Technologies. IEEE, 2006, pp. 418–421. [Google Scholar]
- I. Frissen, B. FG Katz, C. Guastavino: Effect of sound source stimuli on the perception of reverberation in large volumes, in: International Symposium on Computer Music Modeling and Retrieval. Springer, 2009, pp. 358–376. [Google Scholar]
- M.G Blevins, A. Buck, Z.E. Peng, L. Wang: Quantifying the just noticeable difference of reverberation time with band-limited noise centered around 1000 Hz using a transformed up-down adaptive method, in: International Symposium on Room Acoustics, 06 2013. [Google Scholar]
- E. Teret, M.T. Pastore, J. Braasch: The influence of signal type on perceived reverberance. The Journal of the Acoustical Society of America 141, 3 (2017) 1675–1682. [Google Scholar]
- A.O. Vecchi, A. Kohlrausch, W. Lachenmayr, E. Mommertz: Predicting the perceived reverberation in different room acoustic environments using a binaural auditory model. The Journal of the Acoustical Society of America 141, 4 (2017) EL381–EL387. [Google Scholar]
- J. Meyer, L. Picinali: Accommodation to virtual sound rendering in a reverberant room with 3dof and 6dof interaction, in: Forum Acusticum – 11th Convention of the European Acoustics Association, June 2025. [Google Scholar]
- A. Neidhardt, C. Schneiderwind, F. Klein: Perceptual matching of room acoustics for auditory augmented reality in small rooms – literature review and theoretical framework. Trends in Hearing 26 (2022) 23312165221092919. [Google Scholar]
- N. Meyer-Kahlen: Transfer-plausible acoustics for augmented reality. Ph.D. thesis, Aalto University, 2024. [Google Scholar]
- C. Schneiderwind, M. Richter, N. Merten, A. Neidhardt: Effects of modified late reverberation on audio-visual plausibility and externalization in AR, in: 2023 Immersive and 3D Audio: from Architecture to Automotive (I3DA), 2023, pp. 1–9. [Google Scholar]
- W.O. Brimijoin, A.W. Boyd, M.A. Akeroyd: The contribution of head movement to the externalization and internalization of sounds. PLoS One 8, 12 (2013) 12. [Google Scholar]
- A. Lindau, L. Kosanke, S. Weinzierl: Perceptual evaluation of model-and signal-based predictors of the mixing time in binaural room impulse responses. Journal of the Audio Engineering Society 60, 11 (2012) 887–898. [Google Scholar]
- J. Antoni: Orthogonal-like fractional-octave-band filters. The Journal of the Acoustical Society of America 127, 2 (2010) 884–895. [Google Scholar]
- J. Nieuwenhuijse, R. Heusens, E.F. Deprettere: Robust exponential modeling of audio signals, in: Proceedings of the 1998 IEEE International Conference on Acoustics, Speech and Signal Processing, ICASSP ’98 (Cat. No.98CH36181). Vol. 6. IEEE, 1998, pp. 3581–3584. [Google Scholar]
- C. Pörschmann, P. Stade, J.M. Arend: Binauralization of omnidirectional room impulse responses-algorithm and technical evaluation, in: Proceedings of the 20th International Conference on Digital Audio Effects (DAFx-17), Edinburgh, UK, September 5–9, 2017. [Google Scholar]
- J.M. Arend, S.V.A. Garí, C. Schissler, F. Klein, P.W. Robinson: Six-degrees-of-freedom parametric spatial audio based on one monaural room impulse response. Journal of the Audio Engineering Society 69, 7/8 (2021) 557–575. [Google Scholar]
- J.J. Wells: Modal decompositions of impulse responses for parametric interaction. Journal of the Audio Engineering Society 69, 7/8 (2021) 530–541. [Google Scholar]
- R. Badeau, R. Boyer, B. David: EDS parametric modeling and tracking of audio signals, in: Proceedings of the 5th International Conference on Digital Audio Effects (DAFx), 2002, pp. 139–144. [Google Scholar]
- O. Das, J.S. Abel: Modal estimation on a warped frequency axis for linear system modeling. Preprint https://arxiv.org/abs/2202.11192, 2022. [Google Scholar]
- C. Kereliuk, W. Herman, R. Wedelich, D.J. Gillespie: Modal analysis of room impulse responses using subband ESPRIT, in: Proceedings of the International Conference on Digital Audio Effects, 2018. [Google Scholar]
- C. Schneiderwind, L. Treybig: Late reverberation synthesis in small rooms considering modal properties, in: 50th Annual Conference on Acoustics (DAGA), Hannover, Germany, 2024. [Google Scholar]
- A. Neidhardt, F. Klein, N. Knoop, T. Köllmer: Flexible python tool for dynamic binaural synthesis applications, in: eBrief 24, 142nd AES Convention, Berlin, Germany, 2017. [Google Scholar]
- A. Mülleder, M. Romanov, N. Meyer-Kahlen, F. Zotter: Do-it-yourself headphones and development platform for augmented-reality audio, in: AES International Conference, Huddersfield, UK, Aug 2023. [Google Scholar]
- F. Martellotta: The just noticeable difference of center time and clarity index in large reverberant spaces. The Journal of the Acoustical Society of America 128, 2 (2010) 654–663. [Google Scholar]
- M. Hodgson, E.-M. Nosal: Effect of noise and occupancy on optimal reverberation times for speech intelligibility in classrooms. The Journal of the Acoustical Society of America 111, 2 (2002) 931–939. [Google Scholar]
- J. Taylor: The rediscovered railway mysteries and other stories, 2010. Audiobook edition, narrated by Benedict Cumberbatch. Speech excerpt used for research purposes. [Google Scholar]
- Lexicon dry tracks II: Audio CD. Sax-Solo, TU Ilmenau, Electronic Media Technologies Group (archival copy), 1998. [Google Scholar]
- N. Meyer-Kahlen, S.V.A. Garí, T. McKenzie, S. Schlecht, T. Lokki: Transfer-plausibility of binaural rendering with different real-world references, in: Fortschritte der Akustik – DAGA 2022. German Acoustical Society (DEGA), 2022. [Google Scholar]
- V. Best, R. Baumgartner, M. Lavandier, P. Majdak, N. Kopčo: Sound externalization: a review of recent research. Trends in Hearing 24 (2020) 2331216520948390. [CrossRef] [Google Scholar]
- P. Zahorik: Auditory distance perception in humans: a summary of past and present research. Acta Acustica united with Acustica 91 (2005) 409–420. [Google Scholar]
- E. Larsen, N. Iyer, C.R. Lansing, A.S. Feng: On the minimum audible difference in direct-to-reverberant energy ratio. The Journal of the Acoustical Society of America 124, 1 (2008) 450–461. [CrossRef] [PubMed] [Google Scholar]
- A. Neidhardt, A.-M. Zerlik, S. Kamandi: BRIR data set for interactive listener translation in two rooms. Zenodo, 2020, https://doi.org/10.5281/zenodo.3457782. [Google Scholar]
- S. Teng, V.R. Sommer, D. Pantazis, A. Oliva: Hearing scenes: a neuromagnetic signature of auditory source and reverberant space separation. eNeuro 4, 1 (2017). DOI: https://doi.org/10.1523/ENEURO.0007-17.2017. [Google Scholar]
- N. Meyer-Kahlen, S.V. Amengual Garí, I. Ananthabhotla, P. Calamia: A two-dimensional threshold test for reverberation time and direct-to-reverberant ratio, in: 2023 Immersive and 3D Audio: from Architecture to Automotive (I3DA), 2023, pp. 1–8. [Google Scholar]
Cite this article as: Schneiderwind C. De Sena E. & Neidhardt A. 2026. Perceptual effects of modified late reverberation and reverberation time in auditory augmented reality in two rooms. Acta Acustica, 10, 17. https://doi.org/10.1051/aacus/2026012.
All Tables
Frequency-dependent RT, estimated from measured BRIRs in the different octave-bands.
Comparison of room acoustic parameters. The values were estimated from BRIRs with a distance of 2.25 m from the frontal loudspeaker and 0° orientation. RT(T30), DRR, C20, C50, and t s show the values for the left channel only.
Frequency-dependent RT, estimated from a measured RIR in different octave bands.
Comparison of room acoustic parameters for Experiment B. The values were estimated from BRIRs with a distance of 2.25 m from the frontal loudspeaker and 0° orientation. RT (T30), DRR, C20, C50, and ts show the values for the left channel only.
All Figures
|
Figure 1. Illustration of the setup in the LTC seminar room at the University of Surrey, indicating all source and receiver positions used for the measurement. The rectangles depict the positions of tables, which were moved to the walls for the experiment. The black dots on the red line depict the nine measurement positions. |
| In the text | |
|
Figure 2. The Room sketch of the seminar room used in Experiment B. The black dots indicate the nine equally spaced measurement positions along the 2 m long line. |
| In the text | |
|
Figure 3. Photo of the measurement setup in LTC seminar room. |
| In the text | |
|
Figure 4. Distributions of RT, DRR, C20, C50, and t s for the room conditions available in Experiments A and B. Mono and Anchor conditions are excluded. The parameters were calculated from both the left and right channels of all BRIRs across all orientations and positions. |
| In the text | |
|
Figure 5. Results from the listening test of Experiment A for the five questions. The results are pooled over the three signal conditions. The asterix denotes conditions showing a statistically significant difference from the reference room acoustic condition Orig after Bonferroni-Holm correction. |
| In the text | |
|
Figure 6. Mean Spearman’s rho correlation values between the attributes. Q.I to Q.V indicate the questions introduced in Table 1. |
| In the text | |
|
Figure 7. Listening test results for five attributes (Q.I – Q.V) in Experiment B. The asterisk above a boxplot denotes a condition with a significant difference from the ratings of the reference condition Orig after Bonferroni-Holm correction. Ratings were given consecutively for every item. |
| In the text | |
|
Figure 8. Spearman’s rho correlation values between the attributes. Q.I to Q.V indicate the questions introduced in Table 1. |
| In the text | |
Current usage metrics show cumulative count of Article Views (full-text article views including HTML views, PDF and ePub downloads, according to the available data) and Abstracts Views on Vision4Press platform.
Data correspond to usage on the plateform after 2015. The current usage metrics is available 48-96 hours after online publication and is updated daily on week days.
Initial download of the metrics may take a while.