Figure 7
Download original image
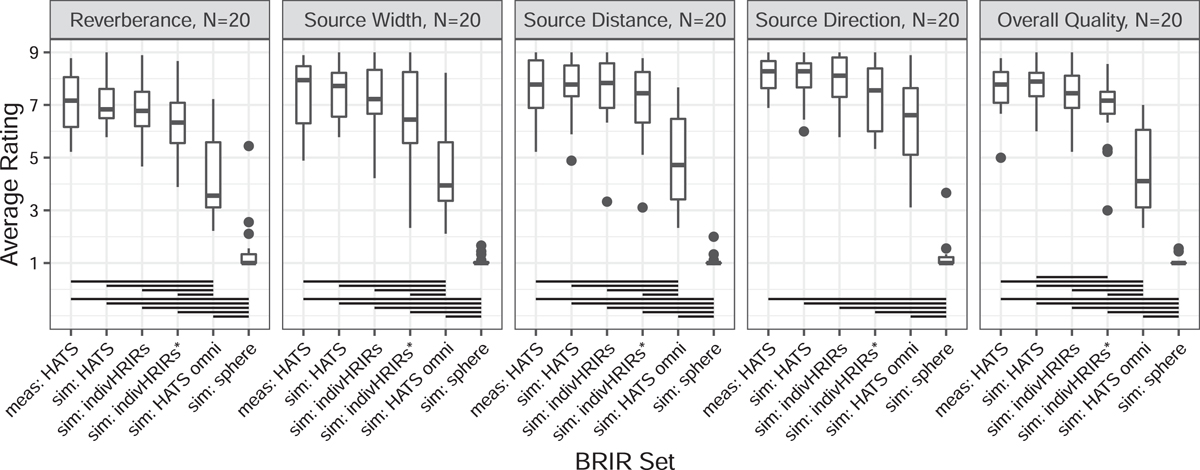
Box plots of ratings, averaged over the three presentations and the three loudspeaker positions, as a function of the BRIR set, for all attributes. A rating of 1 corresponds to “bad”, 9 to “excellent”. Statistically significant differences (post hoc pairwise tests for equal 20% trimmed means based on the bootstrap-t-method, p < 0.05) are indicated by lines in the bottom part of the facets.
Current usage metrics show cumulative count of Article Views (full-text article views including HTML views, PDF and ePub downloads, according to the available data) and Abstracts Views on Vision4Press platform.
Data correspond to usage on the plateform after 2015. The current usage metrics is available 48-96 hours after online publication and is updated daily on week days.
Initial download of the metrics may take a while.