Open Access
Figure 2
Download original image
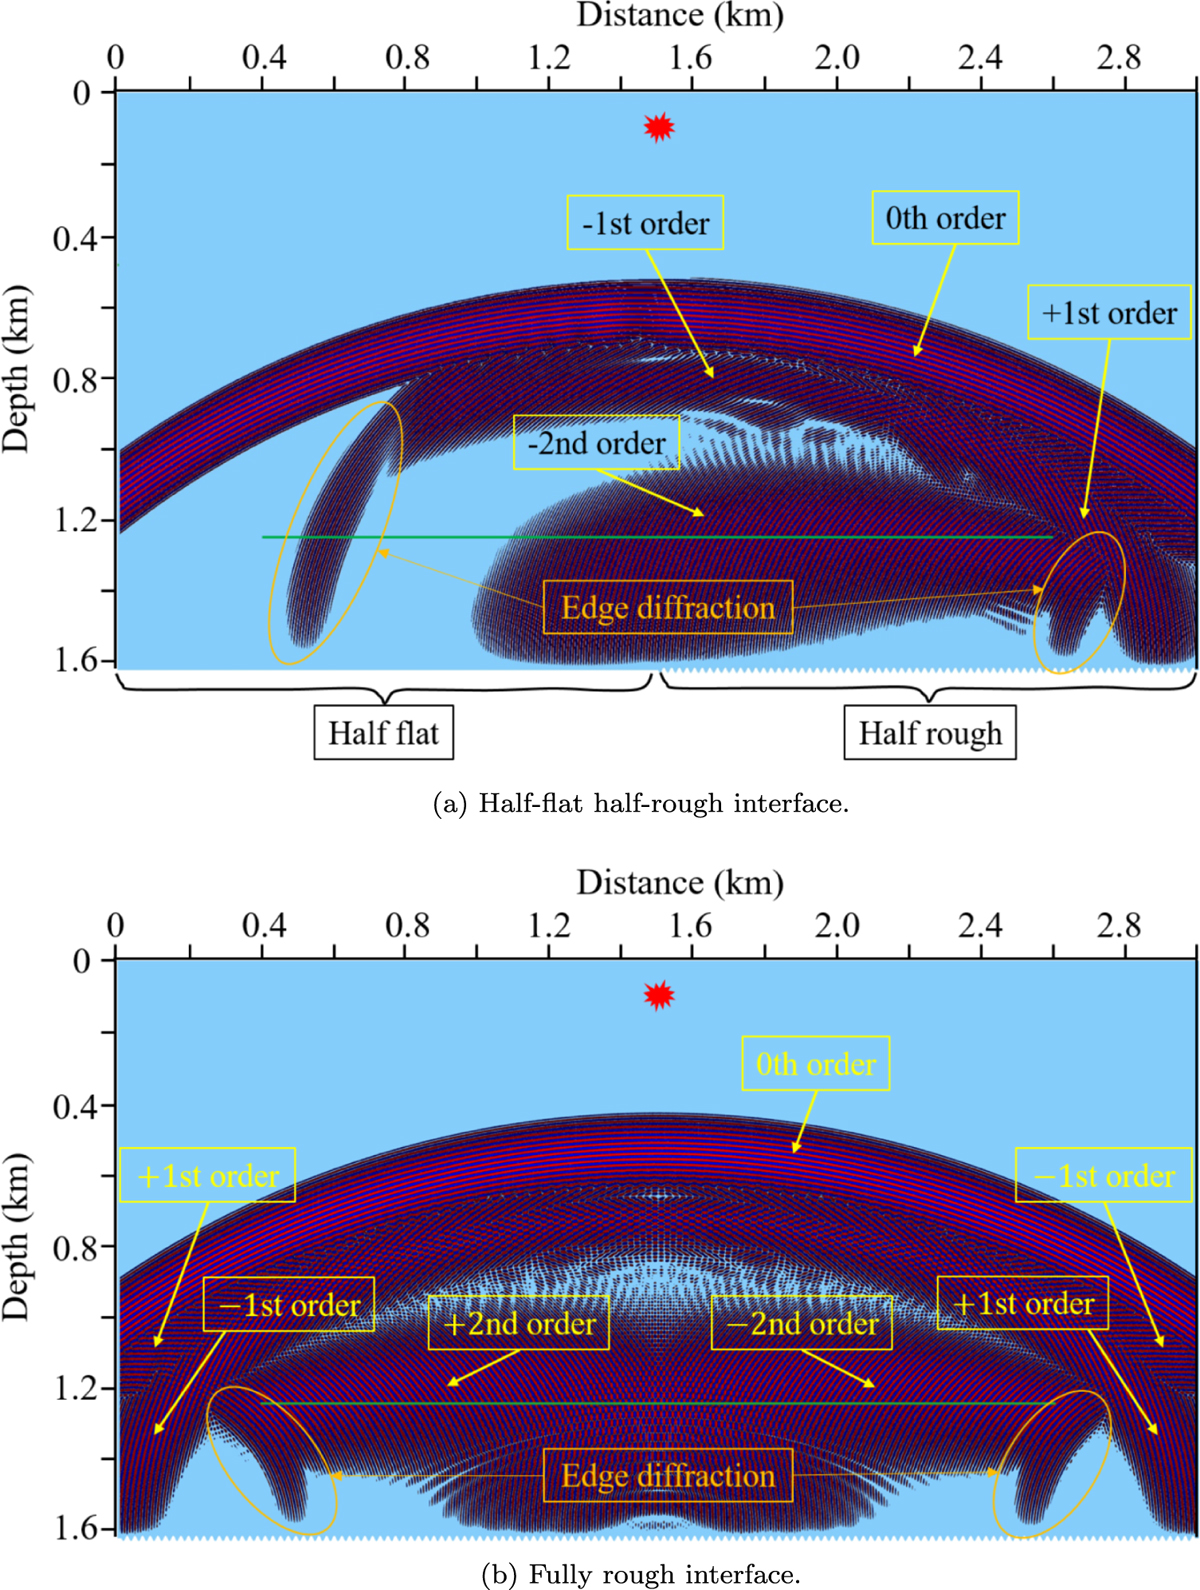
Snapshots (at time (a) t = 1.74 s, (b) t = 1.8 s) of the wavefields after reflection of the incident wavefield from (a) a half-flat half-rough interface, (b) a fully rough interface. The source location is indicated by a red star, while the horizontal array of receivers is indicated by a green line.
Current usage metrics show cumulative count of Article Views (full-text article views including HTML views, PDF and ePub downloads, according to the available data) and Abstracts Views on Vision4Press platform.
Data correspond to usage on the plateform after 2015. The current usage metrics is available 48-96 hours after online publication and is updated daily on week days.
Initial download of the metrics may take a while.