| Issue |
Acta Acust.
Volume 7, 2023
Topical Issue - The Sound of Ancient Theatres
|
|
|---|---|---|
| Article Number | 67 | |
| Number of page(s) | 14 | |
| DOI | https://doi.org/10.1051/aacus/2023059 | |
| Published online | 14 December 2023 | |
Scientific Article
Time-frequency diffraction acoustic modeling of the Epidaurus ancient theatre
Audio & Acoustic Technology Group, Electrical & Computer Engineering Department, University of Patras, 26504 Rio, Greece
* Corresponding author: This email address is being protected from spambots. You need JavaScript enabled to view it.
Received:
21
April
2023
Accepted:
28
October
2023
Abstract
This work provides an in-depth investigation on the effect of sound diffraction in the acoustics of the ancient theatres, with reference to the theatre of Epidaurus. It is increasingly evident that in such theaters, sound diffraction at the edges of the multiple tiers generates significant source signal amplification. Especially for the distant listener positions, an accumulation (“avalanche”) effect from lower tier diffracted energy is identified. This study examines a 3D model of an elementary slice of the seating benches (“koilon”), evaluating the generated sound field in the time, frequency, and spatial domains. The analysis accounts for direct, reflected, diffracted and mixed reflected – diffracted paths and the theatre’s acoustic response is numerically evaluated in various positions along the koilon slice, accurately matching to in-situ measurements. The contribution of the diffracted sound to the total sound field is identified through a detailed and novel analysis of energy-based acoustic parameters, via the time and frequency responses as well as of the spatial parameters relating to listener-perceived effects. In all cases, the contribution of sound diffraction components is examined via its contribution to speech intelligibility from signals generated in the theatre’s orchestra and from a virtual reconstruction of the stage-scenic building.
Key words: Ancient theatres / Acoustc diffraction / Epidaurus theatre / Acoustic simulation
© The Author(s), published by EDP Sciences, 2023
 This is an Open Access article distributed under the terms of the Creative Commons Attribution License (https://creativecommons.org/licenses/by/4.0), which permits unrestricted use, distribution, and reproduction in any medium, provided the original work is properly cited.
1 Introduction
Wave diffraction constitutes a significant component of sound fields that is generated within many real-life environments and geometrical spaces. Diffraction phenomena have been studied in many diverse fields of acoustics, e.g. in underwater acoustics [1–3], aeroacoustics [4, 5], building acoustics [6–13] and electroacoustics [14–18]. Especially for the study of sound propagation around finite surfaces and boundaries such as in room acoustics, it is increasingly evident that the sound field is properly described by both reflected and edge-diffracted components which can only partially be computed by the established geometrical acoustic methods. The contribution of wave diffraction effects in ancient buildings has been already examined for the prehistoric Stonehenge monument in England as well as the Maya pyramids [19–21]. Ancient Greek–Roman open-theatres constitute highly relevant and challenging case-studies for such phenomena since their large-scale audience area and unique geometrical shape consists of multiple semi-circular tier levels folded on a semi-conical structure. The Epidaurus theatre, originally constructed in the 4th century BC, with the upper seating area (“koilon”) added in the 2nd century BC, provides a long-standing benchmark for examining how theoretical concepts and computational models correspond to measured results and listener experiences. This is because of its age-long renowned acoustics, its well-preserved state with absence of later Roman-era modifications, its evolutional Hellenistic-era design, the low levels of environmental noise, the well-documented database of measurements and its contemporary utilization for ancient drama performances [21–32].
In the context of ancient theatre acoustics and specifically for the Epidaurus theatre, recently available computational tools for simulation of diffraction effects [24, 34, 39–41] have been applied for improved understanding of the sound field generated within such spaces. This sound field, beyond the direct and distinct specular reflection paths [32, 36, 42], consists also of diffracted sounds from those paths, generated sequentially from the edges of the tiers along the slope of the seating rows (“cavea” or “koilon”) [22, 24, 33]. As is known [43–49], the propagation of edge diffracted waves strongly depends on the geometry of the field, the relative angles of the propagated path, the shape of the edge of the rigid object and the receiver position. It appears that the geometrical design principles for the slope and dimensions of the tiers for the Epidaurus theatre, especially due to the choice for double slope for the extended upper koilon, contribute to the optimal harvesting of such edge diffraction effects, increasingly so for the most distant listeners [33, 50].
In the past, the tier edge-generated diffraction for this theatre was analytically studied by Declercq and Dekeyser [22] employing a geometric-based acoustic modelling method incorporating multiple orders of diffraction and concluded that the backscattered sound from the koilon amplifies higher frequencies more than low frequencies. In-situ measurements performed by many researchers [23, 25, 26, 31, 52] reveal a more complex spectral pattern with the presence of significant low frequency energy up to 150 Hz, a broad spectral dip at approx. 180 Hz and a strong amplification of the 500–4500 Hz region. The work of Declercq et al. has introduced an important geometrical metric for the “periodicity” of the ancient theatre’s properties as a predictor for its spectral response, but it did not provide a quantitative explanation for the theatre’s exceptional speech intelligibility. Farnetali et al. studied open theatre reflection-diffraction effects with measurements both in-situ and in scale models [25]. Additional effects from the ground floor and koilon, tier steps specular reflections and edge diffraction was also studied in [33, 52] whilst the significance of modelling diffraction paths in simulations of ancient theatre acoustics was demonstrated by Economou and Charalampous [24], Kaleris et al. [33] examined diffraction effects via a wave propagation approach on a detailed 2D section of the theatre profile following precise calibration of the simulation parameters to fit measured impulse responses. This approach, adopted also in this work, provides a controlled platform to detect and categorise the most important sound propagation mechanisms produced by specular reflections, edge diffraction and their higher order combinations, along with the direction of arrival to the receiver, considered here as either ascending or descending. Subsequent work by Menounou et al. [9, 38, 50, 51] provided a method for predicting and identifying propagation paths along complex geometries and elaborated on the concept of reflective and diffractive paths for the Epidaurus geometry [50, 53]. The analytical solution in the frequency and/or time domain relies on a Direct Line Source Model which provides a detailed expression for the distance, angle and directivity contributions to the diffracted component, hereafter referred to as the Diffraction Kernel [38].
Such diffraction-related numerical simulations have recently become feasible via available software, e.g. [34–37, 39], although complex 3D geometries such as a complete model of an ancient theatre, still constitute a challenging venture due to heavy computational load, especially for evaluating higher order diffraction paths. Here, an efficient linear filter representation of diffraction propagation is introduced, based on the analytic Diffraction Kernel (DF), in a simplified parametric form. This approach allows for both the precise matching of the numerical simulations to the measured theatre’s time and spectral responses but also, the detailed examination and quantitative estimation of the different soundfield components on the acoustic indices, speech intelligibility and spectral profile. Furthermore, the exact contribution of diffraction to source signal amplification, especially for the distant listener positions, is analysed via a novel approach where an accumulation (“avalanche”) effect from lower tier diffracted energy is identified. Since current methods for computing the binaural impulse response (BRIR) suitable for auralization, do not fully consider edge diffraction [54–56], the current work also proposes a novel analysis of the binaurally relevant edge diffraction components reaching the listener from the tier where (he/she) is seated and from adjacent tiers/rows of the koilon. In all cases, the above diffraction related effects are also examined for sources located on a virtual reconstruction of the original stage-scenic building of this theatre (“skené”), which is not preserved today.
2 The theatre’s sound field
2.1 Time and frequency response analysis
Following the discussion above, these mechanisms are visualized here with the aid of a computational acoustic model of the theatre (see also Sect. 3) as is shown Figure 1 and can be grouped into three categories:
- (a)
Direct (δ) and early reflected paths (r) formed by first order reflections of the direct signal.
- (b)
Diffracted paths (d) originating from edge diffractions on the benches from the direct path of the source (Figs. 1 and 1b). The double slope of the Epidaurus’ koilon leads to the formation of two ascending diffracted sound fields of the direct signal (purple lines): one from the tiers of the lower koilon and one from the tiers of the upper koilon. Additionally, there are descending diffractions (yellow lines), generated by rows above the listener. Listeners seated in the first tiers of the lower koilon receive mainly the descending diffraction field, while the most distant listeners experience mainly the ascending field.
- (c)
Reflected-diffracted paths (rd) originating from the signal reflected at the orchestra floor (Figs. 1c and 1d). Again, there are ascending diffractions from the lower and upper tiers (cyan line) below the listener and descending diffractions from the tiers above the listener (orange line) (see Figs. 1c and 1d). The latter paths arrive with a delay of more than 100 ms and exhibit low amplitudes. Also, given the prominence of the δ and r components for such positions due to their vicinity to the source, such late paths are not considered in this analysis.
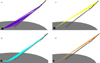 |
Figure 1 Numerical simulations (see Sect. 3) of four diffraction classes of the Epidaurus soundfield between the source located at the centre of the orchestra and receiver R7 (as defined in [26, 33]), a) ascending diffraction paths due to the tiers below the listener (purple); b) descending diffraction paths due to the tiers above the listener (yellow); c) reflected and ascending diffraction paths due to reflection at the orchestra and the tiers below the listener (cyan); (d) reflected and descending diffraction paths due to reflection at the orchestra and the tiers above the listener (orange). |
The linear combination of these components contributing to the soundfield s can be written in a simplified fashion as: (1)
(1)
Following an ideal assumption that a direct signal δ(t) is reaching the listener at t = 0, the general form of the ideal impulse response at an arbitrary position of the cavea can be written as: (2)where hi (t) with i = r, d, rd is the impulse response of a reflection (r) or diffraction (d) component, hrd (t) = hr * hd, with * denoting the linear convolution, is the impulse response of a reflection-diffraction and τi, Ai are the relative time delay and pressure attenuation due to geometric propagation. Here, the diffraction impulse kernel hd (t) is taken from [38] for a finite wedge while the reflection kernel hr (t) clearly depends on the different surface reflectivity properties and was adjusted according to the measured responses. The geometric pressure attenuation is given by
  where c = 343 m/s is the speed of sound in air and r0 is the distance in a straight line between the source and the receiver for the specific path. The complex transfer function of the theatre for a specific receiver is given by the Discrete Fourier Transformation (DFT) of equation (2):
 (3)where Hr(ω), Hd(ω) are the DFTs of the reflection and diffraction kernels respectively. Clearly, the spectra of the composite reflected-diffracted paths result from the multiplication of the reflected and the diffracted kernels’ spectra.
For simplicity in this analysis, any diffusion of discrete reflections, any late reverberation tail, as well as additive ambient noise, are not considered. Moreover, the acoustic source is considered to emit spherical waves with an ideal delta time profile, although in reality the theatre’s acoustic sources i.e., actors, music instruments etc., exhibit a time, frequency and directivity response that deviates from this ideal function. Nevertheless, such a general linear system representation of the theatre’s response allows for any subsequent adaptation of the response to more realistic source profiles.
Regarding the diffraction paths, since the distributed sources formed on the diffracting wedges emit sound in a wide solid angle, a diffracted component reaches the listener only when a direct unobstructed path exists between this listener and the wedge. As shown in Figure 2a, for ascending diffractions and for the diffraction wedge and the receiver within the same koilon section, this criterion is fulfilled when the angle between the wedge E1 and the receiver is larger than the angle θT between two consecutive wedges E1, E2, i.e.: (4)
(4)
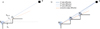 |
Figure 2 a) Geometric condition for a first order diffraction path to reach the listener (R). b) Representation of accumulated diffraction (“avalanche”) effect on three consecutive wedges formed by sequential ascending components. |
Note that θΤ effectively is the slope of the koilon. Due to the different koilon sections and slopes of Epidaurus, when the diffracting wedge is in the lower koilon section and the receiver is in the upper koilon section, then the angle θΤ is the angle of the koilon section with the larger slope, namely that of the upper koilon. This condition is always true when the receiver is at a higher position than the height of any single row bench. The same applies for the case of the descending diffractions, only in this case the angles of equation (4) become negative.
Following the commonly accepted criterion that early acoustic components arriving within 50 ms after the direct signal contribute to the sound clarity and speech intelligibility, the diffraction field of Epidaurus can be quantified via the ratio of the early diffracted acoustic energy DIFFE 50 ms to the total early acoustic energy RIRE 50 ms. By denoting the total acoustic response and the diffracted signal in the discrete time domain as h(τ) and d(τ), respectively, we get: (5)so that:
 (6)
(6)
Equivalently, the ratios dAsc/h50ms and dDesc/h50ms are defined by only considering the ascending dAsc (τ) and the descending dDesc (τ) diffracted components of the respective signals, during the first 50 ms.
Preliminary analysis presented in the Appendix and discussed in Section 5, indicates that higher-order diffractions on the tier edges generates additional cumulative effects on the source energy, especially at distant positions in the upper section.
2.2 Time and frequency domain diffraction kernels
According to [9], edge diffraction can be modelled as sound wave radiation from a directional line source generated on the wedges of each row, characterized by a time domain impulse response hd (t) (the diffraction kernel) for a spherical incident sound wave around a wedge [38]. Figure 3 presents a typical example of such a response where rS, rR are the distances of the source and the receiver from the wedge and θS, θR are the polar angles of the source and the receiver relatively to the wedge in cylindrical coordinates. The exponential decay of the pressure in the diffraction kernel corresponds to the distributed sources along the wedge located at increasing distance from the central intersection point Z. According to [8, 38], the peak value and the specific time profile of a diffraction impulse depends on the parameter rS, rR, θS and θR. A frequency domain representation of the diffraction kernel Hd (ω) (Fig. 3d) clearly shows that it has of a low-pass filter profile.
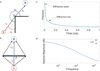 |
Figure 3 a) Side view of a typical diffraction wedge where Z denote the intersection point of the wedge, R is the receiver and S is the source. rr, rs are the distances of source and receiver from point Z and θr, θs the respective angles. b) top view of a typical diffraction wedge. c) Time domain diffraction kernel (first 1 ms) and d) frequency domain kernel profile. |
2.3 Spatial diffraction analysis
Α typical diffraction kernel, such as the one shown in Figure 3, shows that the initial pressure peak corresponds to the signal arriving from the center of the wedge, which constitutes the shortest path between source and receiver. In the symmetric (with respect to the yz plane) scenario considered here, this central sound path always crosses the wedge perpendicularly. The decaying tail of the kernel represents a progressive time delay in the arrival of the lateral diffraction components that originate from increasing distance between the receiver and the wedge points. Also, due to the symmetry of the theatre’s semi-circular shape, the contributions of the right and left wedge sides are equal and are superimposed in time. Similar geometrical considerations for the spatial interpretation of the time-domain diffraction kernel are outlined in the seminal work of Svensson et al. [8].
As shown in Figure 4a, the positions of the distributed point sources along the wedge can be directly calculated through their time delays with respect to the direct signal, by evaluating the intersection points of spheres centered at R with radii ri,R, where i denotes the ith such distributed point source on the wedge. As shown in Figure 4b, the distance ri,R can be calculated by the following set of equations: (7)where ri,S is the distance of the source to the position of the ith distributed source, zi is the distance of the ith distributed lateral source to the center of the wedge along the z axis, Δτi is the delay time of the ith distributed source relatively to the first arriving diffraction source (Diff Source 1) and c is the speed of sound. Combining the above equations, ri,R is equal to:
 (8)
(8)
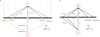 |
Figure 4 a) Front view of a typical diffraction wedge, indicatively showing two distributed diffraction sources formed along the wedge (z-axis) and the respective spheres formed on each diffraction radius ri,R. b) Geometrical representation of the distributed diffraction sources for the derivation of equations (7)–(10). |
Hence, the pairs of lateral left and right-side distributed diffraction sources are the common points of two loci: a) the edge of the wedge and b) the surface of the spheres. By placing the receiver at the point R(0, 0, 0) of the Cartesian coordinate system, the equations describing the two loci are the following: (9)where xwedge, ywedge are the x and y coordinates of the wedge. Combining the above equations, we get the position of each distributed source:
 (10)
(10)
2.4 Binauralization and lateral diffracted energy
As explained, the edge diffracted sounds exhibit lateral components that arrive to the listener at azimuth angles θ and −θ and elevation angle φ. For any human listener, this will result in binaurally received diffracted acoustic components when the relevant azimuth and elevation angles are processed via the appropriate Head Related Transfer Functions (HRTFs). The azimuth and elevation angles of an arbitrary distributed diffraction source along a wedge are shown in Figure 5. From the analysis of Section 2.3, the azimuth and elevation angle of a diffracted component with angle θi are computed for the ascending and descending diffraction field, respectively, as: (11)
(11)
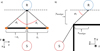 |
Figure 5 a) Plan view of a diffraction wedge, illustrating the azimuth angles (θi and −θi) of a pair of distributed diffraction source. b) Side view of a diffraction wedge, illustrating the elevation angles (φi) of a pair of distributed diffraction source. |
Since each data point in the diffraction kernel corresponds to a different azimuth, a different Head Related Impulse Response (HRIR) is required for its precise binauralization. However, such a computation would be both computationally demanding and potentially inefficient, as the small difference in the angles of two consecutive points would not necessarily lead to a change in the perceived angle of arrival. For this reason and for simplicity, here, the binauralization will be described by using a single representative point for the kernel function, such as the “center of mass”, the median, etc. Following such assumption, the binauralized diffracted signal reaching the listener becomes: (12)where i indicates is the single representative time Instance of the kernel function diffraction component along a wedge.
To further quantify the amount of lateral energy that reaches the listener, the new objective metric Lateral to Direct Diffracted Energy (LDDE) is introduced, defined as the ratio of the energy received by an ideal figure-eight microphone [58] facing the source to the total energy arriving to a listener as captured by an omni-directional microphone during the first 80 ms. This metric was inspired by the Apparent Source Width (ASW), which is effectively is a descriptor of source broadening [57], and is given by the following equation: (13)where in this case θ is the angle between incident sound and the axis of the figure-eight microphone. It has to be noted that despite the resemblances between LDDE and ASW, the proposed metric may not be associated with any perceptual effect and hence it should be strictly interpreted in an objective manner.
Here, for the simulations carried out with the use of a CAD model of the theatre of Epidaurus (see Sect. 3) a virtual figure-eight microphone was considered at the virtual listeners positions. Following the methodology presented in Section 2.3, the angle θ was computed for each diffraction component and the lateral energy was calculated as the square product of the magnitude of each component with the cosine of the corresponding angle.
3 Implementation
The methodology for studying the previously analyzed functions and parameters was based on a 3D model of an elementary slice of the koilon, numerically evaluating the generated sound field in the time, frequency and spatial domains. The analysis accounts for direct, reflected, diffracted and mixed reflection – diffraction paths, and calculates the theatre’s acoustic response in various positions along the koilon, according to the previously defined expressions. These positions (R1, R4, R7 and R10) were defined according to earlier in-situ measurements positions as described in [26, 33]. All results from implementing the analysis of Section 2.3, were compared and validated according to such in-situ measurements of the theatre’s response. As can be seen in Figure 6, the theatre’s numerical model utilized both generic simulation s/w [39] as well as custom s/w for evaluating the theatre’s soundfield [35]. The generic software (s/w) was mostly used for setting up the 3D model, identifying transmission paths according to equation (2) and their corresponding attenuation parameters.
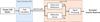 |
Figure 6 Block diagram of the methodology followed for the numerical modeling and simulation of the acoustic response of the Epidaurus theatre. |
The CAD model of Figure 7a, referred to as Model 1, only considers one section (slice) of the koilon, physically existing between two adjacent aisles (cunei), further divided into two cunei sections in the upper part of the koilon. The circular arcs of the section are replaced by straight lines, so that each tier is considered as a wedge of finite length. Moreover, to simplify computations, the center of each tier is considered as the center of the diffraction line source (see also Sect. 2). The path parameters are fed into custom MATLAB [59] code that numerically evaluates the combined response (Eq. (1)) also using the diffraction kernel proposed in [38, 51].
 |
Figure 7 CAD versions of the ancient theatre of Epidaurus a) Model 1; b) Model 2 with added scene and proscenium buildings. R1, R4, R7, R10 and S correspond to the 4 virtual listener and source positions, respectively. |
A second CAD model (Model 2) shown in Figure 7b is also developed incorporating the theatre’s stage building (skene), which does not survive today. In this model, the virtual source is positioned at the front of the stage (proskenion) where the main actors were located during the ancient theatrical performances whilst the positions of the virtual listeners are the same as in Model 1. Model 2 allows for accurate simulation of the theatre’s acoustic response in the form of its original use but also for comparative examination of the stage’s impact on the total soundfield. Here, the additional reflections from the stage building were not considered, but the diffraction components were re-evaluated since they differ between these two models, as the relative angle of the virtual source to the wedges formed by each tier is different [50].
It should be noted that, since this model is limited to a slice of the koilon, potential lateral acoustic features such as specular reflections, scattered or diffracted sound are neglected, although other works have shown that they can play a role in the total transmitted acoustic energy, speech intelligibility and source spread, see for example [36]. Nevertheless, the simplified model used here is convenient as it allows for detailed analysis of the diffraction field in the slice scenario, but also for high frequency rendering up to 20 kHz. Hence, lateral features of the sound field will not be considered. As a final remark, large outdoor listening spaces can exhibit non-negligible vertical temperature gradients (i.e., up to 10 °C in Epidaurus [61]), which in turn affect the speed of sound inducing upward or downward refraction of the soundwaves during daytime or evening, respectively. Although such an effect can have significant impact on the acoustics of the listening space, systematic measurements have not revealed any influence in Epidaurus [61], and for this reason it is not accounted for in this study.
4 Results
4.1 Time domain soundfield
Here, the theatre’s impulse response (see Eq. (1)) assuming an omnidirectional source at the center of the orchestra was derived after fine-tuning the model’s geometrical parameters to match the actual in-situ response measurements [33]. Figure 8a presents a comparison between the model’s predictions and the actual measurements for position R7. The model appears to predict the theatre’s early IR with high accuracy, allowing clear identification of the paths and components of equation (1), although higher order reflections, diffractions and composite paths, as well as diffusion, noise and lateral components, were not considered. Given that the model accurately predicts the composite theatre’s IR, it is now feasible to trace, separate, and closely examine the individual contributions of the different mechanisms described in Section 2.1.
 |
Figure 8 a) Comparison between model IR simulation and actual IR measurement for position R7 (first 8 ms), b) decomposition of the model IR into separate soundfield components (first 8 ms). |
Figure 8b shows such a model-derived IR decomposition of the diffracted components, also noting that the direct path component has been represented by the source’s actual pseudo-anechoic IR used in the in-situ measurements. Figure 9 depicts a detailed analysis of each different type of diffracted components presented in Figure 8, without the source pseudo-anechoic IR (direct path component, δ), so as to better visualize the components of equation (1). The analysis clearly illustrates that accumulated diffraction energy arrives from the lower tiers immediately after the direct signal (Fig. 9a). Similarly, significant diffraction energy is also generated by the reflection on the orchestra floor, arriving within 4 ms after the direct signal (Fig. 9a). Such contribution is stronger for the more distant positions in the upper koilon to increase the early IR level and improve speech intelligibility [33]. The descending diffracted paths exhibit clear backscattering at regular and relatively later time intervals due to the tiers’ geometry (Fig. 9b).
 |
Figure 9 Time domain representation of: a) ascending diffracted and reflected-diffracted paths; b) descending diffracted and reflected-diffracted paths. The pressure values are normalized with respect to the direct signal. |
4.2 Frequency domain soundfield
From the estimated IRs, the spectra were evaluated, and in Figure 10a, a typical 1/12 octave smoothed version is compared to the in-situ measured spectrum. It is clear that the model provides sufficiently accurate estimations of the theatre’s spectral response and thus it is feasible to decompose the modeled spectrum into the individual components according to equation (3), as is shown in Figures 10b and 11. Here it is shown that the ascending diffracted paths (both due to the direct and first-order reflected signal) enhance spectral content in the low and mid frequency range, hence improving SNR at this range. Descending diffracted paths have harmonic-like spectral profile with significant energy at around 200 Hz and its harmonics, due to the constant time interval of roughly 5 ms that these paths arrive (see Sect. 4.1). Such backscattered harmonic spectral components are responsible for the characteristic metallic timbre of the theatre’s response, generated from the specific dimensions of the bench width and height [22]. Furthermore, it is evident that destructive interference between the ascending and descending diffractions occurs, notably at the 150-200Hz region which results to the prominent dip in the theatre’s spectral response.
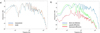 |
Figure 10 a) Comparison between model response spectrum and actual measurement for position R7; b) decomposition of the model spectral response into separate soundfield components. |
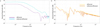 |
Figure 11 1/12 smoothed frequency domain representation of: a) ascending diffracted and reflected-diffracted paths; b) descending diffracted and reflected-diffracted paths. |
4.3 Diffracted versus total acoustic energy
As already noted, a significant amount of acoustic energy is transmitted to the listener via the diffraction field, especially in the upper koilon positions. Figure 12 shows the ratio d/h50ms (see Eq. (6)) for the four different listener positions, with a fitting curve to help visualization. It becomes clear that the early diffractions enhance the acoustic energy in the rows of the upper koilon by more than 20%, reaching 30% at the more distant position of the upper koilon. Additionally, the energy of the late diffracted field after 50 ms constitutes a negligible portion of the total acoustic energy, being more than 100 times lower than the early energy portion. This provides further evidence for the major role of diffraction in the excellent acoustic performance of the theatre and its contribution to speech intelligibility. However, for the lower positions, the contribution of the diffracted field is very low (approx. 2%, due to the descending diffraction) compared to the strong direct signal and thus provides small effect on speech intelligibility which for such positions, it is supported by the strong δ + r components (Eq. (1)). Figure 12 also clearly shows the increasing importance of the ascending diffractions to the total acoustic energy for the distant positions of the upper koilon. In contrast these components have insignificant contribution for the close to the stage positions, where the dissenting diffraction sound is more dominant, along of course with the direct (d) and reflected (r) components.
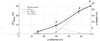 |
Figure 12 Contributions of the early diffraction field to the total acoustic energy reaching the listeners in the positions R1, R4, R7 and R10. |
4.4 Speech intelligibility
Table 1 shows the Speech Transmission Index (STI) calculated from the simulated impulse responses at four different positions shown in Figure 7: R1, R4, R7 and R10, for different source levels and considering an NR-35 ambient noise profile. The noise profile was selected according to in-situ measurements carried out in the frame of this work, that showed excellent matching to the typical NR-35 curve and is shown in Figure 13. Here, STI is evaluated separate for each different components of the impulse response, i.e.: δ + r, δ + r + d and δ + r + d + rd (see Eq. (1)). It is evident that diffractions both from the direct and the reflections greatly increase the STI at the three distant positions (R4, R7 and R10) and for the lower source levels. For the position R1, the increase due to diffracted paths is almost negligible for all source levels, given also that the downward diffraction components dominate. An interesting result is that reflected-diffracted paths appear to increase STI more than the diffracted paths from the direct signal. Similar trends can be also observed for Model 2, ‘though overall STI was marginally lower than for the Model 1. In this case the relative increase of STI due to the diffracted and reflected-diffracted components is lower than in Model 1, indicating that the higher vertical position of the speaker/actor may decrease the impact of diffractions on STI. Note here, that in real-life the amplitude of all these paths will strongly depend on the impedance and geometrical imperfections of the orchestra ground and bench materials. Further analysis presented in Table 2, shows STI values for ascending and descending diffractions. For the position R1, due to proximity to the source, the STI is mainly dependent on the direct signal and the reflection. However, for positions R4 and R7 the descending diffractions have a negative impact on STI, especially for the lower source levels (60, 70 dB), while ascending paths contribute positively to speech intelligibility. For position R10 there are no descending diffractions, as it is located in the last tier of the upper koilon, these results being in accordance with [38].
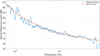 |
Figure 13 1/12 smoothed frequency domain representation of the measured noise in the theatre of Epidaurus and NR-35 curve. |
STI values of Model 1 and 2 for different source levels and for the different propagation mechanisms.
STI for ascending du and descending dd diffractions.
4.5 Lateral to direct diffracted energy
Based on the analysis presented in Section 2.3, LDDE was computed for four different listener positions (R1, R4, R7 and R10). The results for diffracted, reflected-diffracted paths and their combination are shown in Table 3. The results show that the LDDE of the diffracted paths have very small values for all receiver positions, indicating that most of the diffracted energy reaches the listener from the center of the tiers. Hence, despite the fact that the sound is re-radiated throughout the entire length of a theater’s tier (wedge), the energy of the lateral components that reaches the listener is notably low, suggesting that diffracted paths may not have an impact on a perceived broadening of the source. Especially, the distant positions have lower LDDE, resulting to a narrower and more focused source acoustic image. Such a spatial property of the diffracted sound for the distant positions may contribute to a finer localization of the sources located at the orchestra. Note that the ascending diffracted paths have lower LDDE for increasing source-receiver distance, while the descending paths in general, have higher lateral energy “though at these positions, their impact on total LDDE becomes negligible. A qualitative representation of the LDDE of the diffracted paths for the virtual listener R4, indicating a possible minor impact of both ascending and descending diffractions on the spread of the source is shown in Figure 14.
 |
Figure 14 Qualitative representation of the diffracted components on LDDE for receiver R4. Descending diffraction components have greater LDDE values, while ascending components from lower tiers, have smaller values. |
LDDE values (%) for four different receiver positions and for different diffraction propagation mechanisms.
5 Discussion
The detailed model-based analysis of the unique acoustic properties of the Epidaurus ancient theatre, highlighted the synergetic effect of careful koilon design and the edge diffraction generated by the multiple tiers. Clearly, for the distant listener positions in the upper koilon, the ascending diffraction components from the direct and reflected paths contribute measurable benefits towards the excellent speech intelligibility providing a plausible explanation of the high STI values at such distant listener positions. Interestingly, the diffracted paths generated by the reflection on the orchestra floor appear to increase the STI more than the diffracted paths from the direct signal, possibly due to the near-identical arrival times of these paths, which results in the formation of an accumulated diffraction front. For a position close to the stage, there are limited ascending diffraction components and the STI mainly depends on the direct signal and the reflection whilst the descending diffractions arrive with repetitive and longer delays from the upper rows, having a minor negative impact on the STI. However, these components generate a characteristic timbral profile resulting from the specific bench dimensions.
Such analysis can be juxtaposed with the design principles followed in period, as described by the surviving relevant text by Marcus Vitruvius Pollio (70–15 B.C.) [60]:
. It is evident that geometric principles were adopted in period by the ancient architects, ‘though the procedure followed to arrive in these well-judged design principles, eludes our current knowledge.“…the height of the benches and the radius of the koilon must be designed so that the sound reaching the listeners will be harmonic and clear without any interferences. For this, the height of the benches must be designed according to the height of the theatre. However, this height must not exceed the width of the aisles to allow the sound wave to just “touch” the edges of the benches and reach the listeners unobstructed so that the endings of the words to be clearly perceived…”
The analysis here does not extend to higher-order diffractions, which are likely to amplify the impact of diffraction. Exact modelling of such phenomena is computationally challenging and beyond the scope of this work and will be considered in future, “though a simplified quantitative analysis is given in the Appendix”. Briefly, from any conical source formed on a diffracting wedge, there is always an acoustic ray reaching the wedge of the immediate upper tier (see for example Fig. 2b), generating another secondary source on that wedge, and so on. This accumulation mechanism is termed here as “diffraction avalanche” effect. Although the individual diffraction components and paths may have low amplitudes, the combined effect over the multitude of the koilon tiers, significantly enhances the early sound components reaching listeners in the most distant positions, noting also that there are no intermediate delays in such propagation mechanism. The avalanche emission of the secondary diffraction sources, when seen from a geometrical perspective, forms a fractal-like sound field which is repeated with each diffraction order, only at a different pressure magnitude.
This work has highlighted an additional property for the listener-perceived spatial identification of the sources, since due to the symmetry of the koilon, the beneficial diffracted components provide highly coherent lateral energy to the two ears. Past binaural response recordings of the Epidaurus theatre [61], also indicate highly coherent with frequency IACC results. Here, the quantitative LDDE results illustrate that as the distance from the sound source increases, the number of increasing ascending diffracted paths generate highly coherent lateral early energy. Thus, a listener can perceive a sharp acoustic image of the distant sources on the stage, tracing their positions and movements. This phenomenon is often commented by todays’ listeners in the theatre and can be observed in binaural recordings of contemporary ancient drama performances [61].
6 Conclusions
Following an elaborate analysis of the different sound propagation mechanisms in the Epidaurus theatre, the properties and contributions of the direct, reflected, diffracted paths and their combinations have been presented. This was done via the development of linear-filter computational models accounting for all these mechanisms, which were calibrated and evaluated against acoustic measurements, showing very good matching in the time, frequency and spatial domain. The study focused on the role of diffraction in the theatre’s excellent acoustic characteristics, especially in the most remote seats, as is registered by the total acoustic energy reaching the listener and the speech intelligibility evaluated via the STI. The novel linear filter of the complete acoustic response of the theatre was based on reflection and diffraction kernels and the 1st order diffraction paths of the direct and reflected signals were separated into ascending and descending sound fields. It was found that although both ascending and descending diffraction fields contribute to the total acoustic energy reaching the listener, only the ascending field has a positive contribution to the STI. This effect significantly contributes to the theatre’s acoustics: as the distance from the sound source increases, the number of ascending diffracted paths also increases while the number of descending paths decreases. Therefore, diffraction has an increasing – with distance – positive impact on speech intelligibility, compensating for the lower levels of the direct and reflected signals. Such benefits were identified to be largely due to the careful design choices made for the theatre’s two koilon section slopes.
Quantitative evaluations of the contribution of different propagation mechanisms to the total acoustic energy via the computational model showed that the ascending 1st order diffractions constitute a 30% of the total acoustic energy in the most remote positions. Conversely, the descending field in the closest positions, which are exposed to strong direct signals, constitutes a low 2%, hence not imposing any detrimental effects on speech intelligibility. Moreover, comparison to evaluations neglecting 1st order diffractions showed that diffraction raises the STI above the critically low intelligibility level across all tiers in both the lower and upper koilon for source levels as low as 60 dB. The model’s augmentation with sources located on the theatre’s scenic/stage building, which does not exist today, produced a similar trend in the results, albeit with lower STI values. However, these results did not consider the reflection from the building’s stage floor (“proskenion”) or from the back walls, due to the resulting heavy computational requirements to the model and are thus left for future investigation. For similar reasons, all tests only considered omnidirectional sound sources. Finally, the adoption of the slice geometry enables the very detailed study of diffracted paths in the two dimensions, however it does not allow for the evaluation of lateral acoustic features originating by the sides of the koilon. Such features, although generally low in amplitude, have been shown by some works to contribute to the good speech intelligibility.
In the frequency domain, both measurements and numerical modeling clearly showed the beneficial to speech intelligibility spectral amplification in the range between 250 Hz and 5 kHz. This spectral property of the theatre can be attributed to the combined effect of all propagation mechanisms discussed above. Both the model and measurements further revealed significant acoustic energy accumulation in a lower frequency band centered around 100 Hz, which is related to the low pass characteristics of edge diffraction, as reflected in the respective diffraction kernel. The prominent spectral gap in the 150 Hz – 180 Hz range, which is evident in the measurements, was also reproduced by the model, indicating that out-of-phase contributions of the ascending and descending diffracted fields exist in this region, beyond the known effect of the ground reflection. Interestingly, due to the model’s flexibility in isolating all propagation mechanisms, the theatre’s characteristic harmonic spectral profile (ringing) that is clearly audible mostly at the orchestra, can be associated to the descending diffracted field. Such a spectral profile is largely generated by the specific bench width/height ratio of this theatre. The geometrical symmetry of the theatre’s sections, along with the exponentially decaying lateral acoustic energy of the diffracted field with respect to any listening position, results to highly coherent signals arriving in the two ears of the listeners, which is crucial for precise source localization, especially in the most remote positions. This was also indicated by the low Lateral to Direct Diffraction Energy (LDDE) metric evaluated by the model, increasingly so when the ascending diffraction field was added. These findings agree to measured IACC values and were also verified by informal listening tests of the model-derived binauralized theatre response.
Finally, a preliminary evaluation of the impact of higher order diffractions was theoretically analyzed and preliminary quantitative estimations were carried out. It was found that sound propagation via higher order diffraction paths leads to an “avalanche effect”, especially with respect to diffraction effects generated from the lower koilon section, which potentially has a multiplicative impact on the diffracted acoustic energy reaching the listeners. This effect could further contribute to the previously described diffraction-related increase of the total acoustic energy, especially for the most remote positions. Such effects, especially with respect to their potential fractal-like geometric characteristics resulting from the theatre’s geometric proportions, will be studied in future work. The current analysis was focused on the Epidaurus theatre, mainly due to its renowned acoustic properties and its unmodified and well-preserved state, allowing verification of the developed numerical model by comparison to in-situ measurements. However, the linear filter approach adopted here for modeling diffraction and reflection-diffraction effects, beyond its utilization for this specific geometry, it provides a general and flexible framework and can be easily adapted to other ancient theatres and potentially to other building acoustics problems.
Data availability statement
The research data associated with this article are available in GitHub, under the reference [62].
References
- J.C. Piquette: Direct measurements of edge diffraction from soft underwater acoustic panels. Journal of the Acoustical Society of America 95 (1994) 3090–3099. [CrossRef] [Google Scholar]
- H. Medwin, C.S. Clay: Fundamentals of acoustical oceanography (Applications of modern acoustics). Academic Press, San Diego. 1997. [Google Scholar]
- F. John, M. Cimdins, H. Hellbrück: Underwater ultrasonic multipath diffraction model for short range communication and sensing applications. IEEE Sensors Journal 21 (2021) 22934–22943. [CrossRef] [Google Scholar]
- K. Huh, R. Agarval, S. Widnall: Numerical simulation of acoustic diffraction of two-dimensional rigid bodies in arbitrary flows, in: 13th Aeroacoustics Conf, 1990. [Google Scholar]
- M. Roger, S. Moreau, K. Kucukcoskun: On sound scattering by rigid edges and wedges in a flow, with applications to high-lift device aeroacoustics. Journal of Sound and Vibration 362 (2016) 252–275. [CrossRef] [Google Scholar]
- H. Medwin, E. Childs, G.M. Jebsen: Impulse studies of double diffraction: A discrete Huygens interpretation. Journal of the Acoustical Society of America 72 (1982) 1005–1013. [Google Scholar]
- J.H. Rindel: Attenuation of sound reflections due to diffraction, in: Proc. of Nordic Acoustical Meeting (NAM), 1986, pp. 257–260. [Google Scholar]
- U.P. Svensson, R.I. Fred, J. Vanderkooy: An analytic secondary source model of edge diffraction impulse responses. Journal of the Acoustical Society of America 106 (1999) 2331–2344. [CrossRef] [Google Scholar]
- P. Menounou, I.J. Busch-Vishniac, D.T. Blackstock: Directive line source model: A new model for sound diffraction by half planes and wedges. Journal of the Acoustical Society of America 107 (2000) 2973–2986. [CrossRef] [PubMed] [Google Scholar]
- S.T. Cho, V.W. Sparrow: Diffraction of sonic booms around buildings resulting in the building spiking effect. Journal of the Acoustical Society of America 129 (2011) 1250–1260. [CrossRef] [PubMed] [Google Scholar]
- M.C. Remillieux, J.M. Corcoran, T.R. Haac, R.A. Burdisso, U.P. Svensson: Experimental and numerical study on the propagation of impulsive sound around buildings. Applied Acoustics 73 (2012) 1029–1044. [CrossRef] [Google Scholar]
- M.C. Remillieux, S.M. Pasareanu, U.P. Svensson: Numerical modeling of the exterior-to-interior transmission of impulsive sound through three-dimensional, thin-walled elastic structures. Journal of Sound and Vibration 332 (2013) 6725–6742. [CrossRef] [Google Scholar]
- R. Mehra, N. Raghuvanshi, A. Chandak, D.G. Albert, D.K. Wilson, D. Manocha: Acoustic pulse propagation in an urban environment using a three-dimensional numerical simulation. Journal of the Acoustical Society of America 135, 6 (2014) 3231–3242. [CrossRef] [PubMed] [Google Scholar]
- R.M. Bews, M.J. Hawksford: Application of the Geometric Theory of Diffraction (GTD) to diffraction at the edges of loudspeaker baffles. Journal of the Audio Engineering Society 34, 10 (1986) 1–9. [Google Scholar]
- J. Vanderkooy: A simple theory of cabinet edge diffraction. Journal of the Audio Engineering Society 39 (1991) 923–933. [Google Scholar]
- FI.T. Agerkvist: A study of simple diffraction models, in: 102nd AES Conv, 1997, p. 4438. [Google Scholar]
- M. Urban, C. Heil, C. Pignon, C. Combet, P. Bauman: The Distributed Edge Dipole (DED) model for cabinet diffraction effects. Journal of the Audio Engineering Society 52, 10 (2004) 1043–1059. [Google Scholar]
- T. Skogberg: Loudspeaker Cabinet Diffraction. Acoustical Technology, Ørsted●DTU, 2006. [Google Scholar]
- B.M. Fazenda, I. Drumm: Recreating the sound of Stonehenge. Acta Acustica 99, 1 (2013) 110–117. [CrossRef] [Google Scholar]
- D. Lubman: Uncanny acoustic effects at Chichen Itza: Intentional design? The Acoustics of Ancient Theatres Conf., Patras. 2011. [Google Scholar]
- D. Lubman: On the acoustics of Maya pyramids. Journal of the Acoustical Society of America 137 (2015) 2427–2427. [CrossRef] [Google Scholar]
- N. Declercq, C. Dekeyser: Acoustic diffraction effects at the Hellenistic amphitheatre of Epidaurus. Journal of the Acoustical Society of America 121, 4 (2007) . [Google Scholar]
- T. Lokki, A. Southern, S. Siltanen, L. Savioja: Studies of Epidaurus with a hybrid room acoustics modelling method, in: The Acoustics of Ancient Theatres Conf, Patras. 2011. [Google Scholar]
- P. Economou, P. Charalampous: The significance of sound diffraction effects in simulating acoustics in ancient theatres. Acta Acustica United with Acustica 99 (2013) 48–57. [CrossRef] [Google Scholar]
- A. Farnetani, N. Prodi, R. Pompoli: On the acoustics of ancient Greek and Roman theatres. Journal of the Acoustical Society of America 124, 3 (2008) 1557–1567. [CrossRef] [PubMed] [Google Scholar]
- S. Vassilantonopoulos, P. Hatziantoniou, N.-A. Tatlas, T. Zakynthinos, D. Skarlatos, J.N. Mourjopoulos: Measurement and Analysis of the Acoustics of Epidaurus, The Acoustics of Ancient Theatres Conf, Patras. 2011. [Google Scholar]
- A. Farnetani, N. Prodi, P. Fausti: Validation of a numerical code for the edge diffraction on a scale model of an ancient theatre, The Acoustics of Ancient Theatres Conf, Patras. 2011. [Google Scholar]
- S.L. Vassilantonopoulos, J.M. Mourjopoulos: Virtual acoustic reconstruction of ritual and public spaces of ancient Greece. Acta Acustica united with Acustica 87, 5 (2001) 604–609. [Google Scholar]
- S.L. Vassilantonopoulos, J.N. Mourjopoulos: A study of ancient Greek and Roman theatre acoustics. Acta Acustica united with Acustica 89, 1 (2003) 123–136. [Google Scholar]
- K. Chourmouziadou, J. Kang: Acoustic evolution of ancient Greek and Roman theatres. Applied Acoustics 69 (2008) 514–529. [CrossRef] [Google Scholar]
- S. Psarras, P. Hatziantoniou, M. Kountouras, N.-A. Tatlas, J. Mourjopoulos, D. Skarlatos: Measurement and analysis of the Epidaurus ancient theatre acoustics. Acta Acustica united with Acustica 99 (2013) 30–39. [CrossRef] [Google Scholar]
- R.R. Torres, U.P. Svensson, M. Kleiner: Edge diffraction in room acoustics computations, in: Proc. of EAA Symposium on Architectural Acoustics, Madrid. 2000. [Google Scholar]
- K. Kaleris, G. Moiragias, G. Kamaris, J. Mourjopoulos: Wave-based acoustic modeling of the Epidaurus theatre, in: Proceedings of Euronoise 2018 Conference, Hellenic Institute of Acoustics, Crete, Greece, 2018, pp. 2161–2168. [Google Scholar]
- B.-I. Dalenbäck: Automatic edge diffusion, in: Manual for CATT-Acoustic Version 7.2, Section 2.5. 1999. [Google Scholar]
- Olive Tree Lab, PE: Mediterranean Acoustics Research and Development. https://www.mediterraneanacoustics.com/olive-tree-lab-suite.html (ac. 08.05.22). [Google Scholar]
- T. Lokki, A. Southern, S. Siltanen, L. Savioja: Acoustics of Epidaurus – studies with room acoustics modelling methods. Acta Acustica United With Acustica 99 (2013) 40–47. [CrossRef] [Google Scholar]
- U.P. Svensson: Edge Diffraction Matlab Toolbox (EDtoolbox). https://github.com/upsvensson/Edge-diffraction. 2022. [Google Scholar]
- P. Menounou, P. Nikolaou: Analytical model for predicting edge diffraction in the time domain. Journal of the Acoustical Society of America 142, 6 (2017) 3580. [CrossRef] [PubMed] [Google Scholar]
- A. Erraji, J. Stienen, M. Vorländer: The image edge model. Acta Acustica 5, 1 (2021) 17. [CrossRef] [EDP Sciences] [Google Scholar]
- B.-I. Dalenbäck: Whitepaper regarding diffraction v8, CATT-Acoustic, January 9 2023, https://www.catt.se/. [Google Scholar]
- Odeon Room Acoustics Software, Odeon A/S, accessed 18.04.2023, https://odeon.dk/ . [Google Scholar]
- V. Papathanasopoulos: The Acoustics of Greek Theatre. PhD Dissertation, NTUA, Athens, 1947. [Google Scholar]
- M.A. Biotand, I. Tolstoy: Formulation of wave propagation in infinite media by normal coordinates with an application to diffraction. Journal of the Acoustical Society of America 29 (1957) 381–391. [CrossRef] [Google Scholar]
- C.S. Clayand, W.A. Kinney: Numerical computations of time-domain diffractions from wedges and reflections from facets. Journal of the Acoustical Society of America 83 (1988) 2126–2133. [CrossRef] [Google Scholar]
- A.M.J. Davis: The complete extension of the Biot-Tolstoy solution to the density contrast wedge with sample calculations. Journal of the Acoustical Society of America 101 (1997) 1821–1835. [CrossRef] [Google Scholar]
- N. Tsingos, T. Funkhouser, A. Ngan, I. Carlbom: : Modeling acoustics in virtual environments using the uniform theory of diffraction, in: Proc. Conf. on Comp. Graphics and Interactive Techniques, Sage, NY, 2001, pp. 545–552. [Google Scholar]
- V. Pulkki, T. Lokki, L. Savioja: Implementation and visualization of edge diffraction with image-source method, in The 112nd Audio Engineering Society (AES) Convention. 2002. [Google Scholar]
- T. Lokki, V. Pulkki: Measurement and theoretical validation of diffraction from a single edge, in: Proc. Int. Congress on Acoustics. 2004, pp. 929–932. [Google Scholar]
- L. Savioja, U.P. Svensson: Overview of geometrical room acoustic modeling techniques. Journal of the Acoustical Society of America 138 (2015) 708–730. [Google Scholar]
- P. Menounou, S. Bougiesis: Theoretical investigation of diffraction phenomena in the ancient theatre of Epidaurus, in: The Acoustics of Ancient Theatres 2nd Symposium, Verona. 2022. [Google Scholar]
- P. Menounou, et al.: A Virtual Source Method for the prediction of the sound field around rigid obstacles, in: EuroNoise 2018. 2018. [Google Scholar]
- F. Canac: L’acoustique des Théâtre’s antiques. CNRS, Paris, 1967. [Google Scholar]
- K. Kaleris, G. Moiragias, P. Hatziantoniou, J. Mourjopoulos: Time-frequency diffraction acoustic modeling of the Epidaurus theatre, in: The Acoustics of Ancient Theatres 2nd Symposium, Verona. 2022. [Google Scholar]
- M. Kleiner, B.-I. Dalenbäck, P. Svensson: Auralization-an overview. Journal of the Audio Engineering Society 41 (1993) 861–875. [Google Scholar]
- R.R. Torres, U.P. Svensson, M. Kleiner: Computation of edge diffraction for more accurate room acoustics auralization. Journal of the Acoustical Society of America 109, 2 (2001) 600–610. [CrossRef] [PubMed] [Google Scholar]
- T. Lokki, P. Svensson, L. Savioja: An efficient auralization of edge diffraction, in: 21st AES Int. Conf., 2002. [Google Scholar]
- M. Barron: Auditorium acoustics and architectural design. Spon Press, New York, 2010. [Google Scholar]
- J. Eargle: The microphone book: from mono to stereo to surround – a guide to microphone design and application. 2nd ed., Focal Press, 2012. [CrossRef] [Google Scholar]
- MATLAB: version R2022a. The MathWorks Inc., Natick, Massachusetts, 2022. [Google Scholar]
- Vitruvius: The ten books on architecture, translated by Morgan MH. Harvard University Press, London/Cambridge, MA, 1914. [Google Scholar]
- S.P. Psarras, M. Kountouras: Acoustic and environmental parameter measurements in Epidaurus Ancient Theatre, in: The Acoustics of Ancient Theatres Conf., Patras, Greece, 2011. [Google Scholar]
- G. Moiragias: Epidaurus Simulations (version 1.0) [data]. GitHub, 2023. https://github.com/YorgosMoiragias/epidaurus_simulations. [Google Scholar]
Appendix
Higher order diffraction effects
Higher-order diffraction field (n ≥ 2, where n is the diffraction order) can be estimated by considering the attenuation of the sound field for each diffraction added to a path. By introducing the average pressure attenuation b for successive higher order diffractions, calculated over the different possible angles θ and φ, the acoustic pressure of the nth-order diffraction in relation to the normalized first-order diffracted signal, can be written as: (A1)
(A1)
Assuming negligible time differences in the of arrival of the rays, the relative acoustic pressure dav generated by the accumulated (“avalanche”) diffraction can be approximated by summing over all higher diffraction orders ![Mathematical equation: $ n\in \left[2,N\right]$](/articles/aacus/full_html/2023/01/aacus230052/aacus230052-eq18.gif) :
: (A2)
(A2)
Preliminary numerical evaluations of the simple model of Figure A1, show that for the Epidaurus theatre, b ≅ 0.25. Calculation for N = 5 at position R10, assuming a secondary source on the 1st lower koilon tier, Equation (A2) gives dav = 0.33, indicating a pressure increase of 33% compared to the field of the 1st order diffraction, not accounted for by the computational model of Section 3. Moreover, due to the higher slope of the upper koilon, there always exists a direct path from a tier of the lower koilon to all tiers of the upper koilon. Hence, any single diffraction at the lower koilon will induce Nu second-order diffraction paths at the upper koilon, where Nu = 21 is the number of tiers in the upper koilon. The total upper koilon second-order diffraction pressure  formed by a single diffraction at the lower koilon can be expressed by:
 (A3)
(A3)
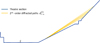 |
Figure A1 Second-order diffraction paths |

Finally, accounting for a number  of lower koilon tiers (
 ), the total second order diffraction field becomes:
 (A4)
(A4)
This simple analysis demonstrates that the avalanche diffracted field formed between the lower and upper koilon is stronger than the respective field within the same koilon. However, further verification must be provided in future via a complete wave model of the theatre’s geometry and by in-situ measurements.
Cite this article as: Kaleris K. Moiragias G. Hatziantoniou P. & Mourjopoulos J. 2023. Time-frequency diffraction acoustic modeling of the Epidaurus ancient theatre. Acta Acustica, 7, 67.
All Tables
STI values of Model 1 and 2 for different source levels and for the different propagation mechanisms.
LDDE values (%) for four different receiver positions and for different diffraction propagation mechanisms.
All Figures
|
Figure 1 Numerical simulations (see Sect. 3) of four diffraction classes of the Epidaurus soundfield between the source located at the centre of the orchestra and receiver R7 (as defined in [26, 33]), a) ascending diffraction paths due to the tiers below the listener (purple); b) descending diffraction paths due to the tiers above the listener (yellow); c) reflected and ascending diffraction paths due to reflection at the orchestra and the tiers below the listener (cyan); (d) reflected and descending diffraction paths due to reflection at the orchestra and the tiers above the listener (orange). |
| In the text | |
|
Figure 2 a) Geometric condition for a first order diffraction path to reach the listener (R). b) Representation of accumulated diffraction (“avalanche”) effect on three consecutive wedges formed by sequential ascending components. |
| In the text | |
|
Figure 3 a) Side view of a typical diffraction wedge where Z denote the intersection point of the wedge, R is the receiver and S is the source. rr, rs are the distances of source and receiver from point Z and θr, θs the respective angles. b) top view of a typical diffraction wedge. c) Time domain diffraction kernel (first 1 ms) and d) frequency domain kernel profile. |
| In the text | |
|
Figure 4 a) Front view of a typical diffraction wedge, indicatively showing two distributed diffraction sources formed along the wedge (z-axis) and the respective spheres formed on each diffraction radius ri,R. b) Geometrical representation of the distributed diffraction sources for the derivation of equations (7)–(10). |
| In the text | |
|
Figure 5 a) Plan view of a diffraction wedge, illustrating the azimuth angles (θi and −θi) of a pair of distributed diffraction source. b) Side view of a diffraction wedge, illustrating the elevation angles (φi) of a pair of distributed diffraction source. |
| In the text | |
|
Figure 6 Block diagram of the methodology followed for the numerical modeling and simulation of the acoustic response of the Epidaurus theatre. |
| In the text | |
|
Figure 7 CAD versions of the ancient theatre of Epidaurus a) Model 1; b) Model 2 with added scene and proscenium buildings. R1, R4, R7, R10 and S correspond to the 4 virtual listener and source positions, respectively. |
| In the text | |
|
Figure 8 a) Comparison between model IR simulation and actual IR measurement for position R7 (first 8 ms), b) decomposition of the model IR into separate soundfield components (first 8 ms). |
| In the text | |
|
Figure 9 Time domain representation of: a) ascending diffracted and reflected-diffracted paths; b) descending diffracted and reflected-diffracted paths. The pressure values are normalized with respect to the direct signal. |
| In the text | |
|
Figure 10 a) Comparison between model response spectrum and actual measurement for position R7; b) decomposition of the model spectral response into separate soundfield components. |
| In the text | |
|
Figure 11 1/12 smoothed frequency domain representation of: a) ascending diffracted and reflected-diffracted paths; b) descending diffracted and reflected-diffracted paths. |
| In the text | |
|
Figure 12 Contributions of the early diffraction field to the total acoustic energy reaching the listeners in the positions R1, R4, R7 and R10. |
| In the text | |
|
Figure 13 1/12 smoothed frequency domain representation of the measured noise in the theatre of Epidaurus and NR-35 curve. |
| In the text | |
|
Figure 14 Qualitative representation of the diffracted components on LDDE for receiver R4. Descending diffraction components have greater LDDE values, while ascending components from lower tiers, have smaller values. |
| In the text | |
|
Figure A1 Second-order diffraction paths |
| In the text | |
Current usage metrics show cumulative count of Article Views (full-text article views including HTML views, PDF and ePub downloads, according to the available data) and Abstracts Views on Vision4Press platform.
Data correspond to usage on the plateform after 2015. The current usage metrics is available 48-96 hours after online publication and is updated daily on week days.
Initial download of the metrics may take a while.