Figure 6
Download original image
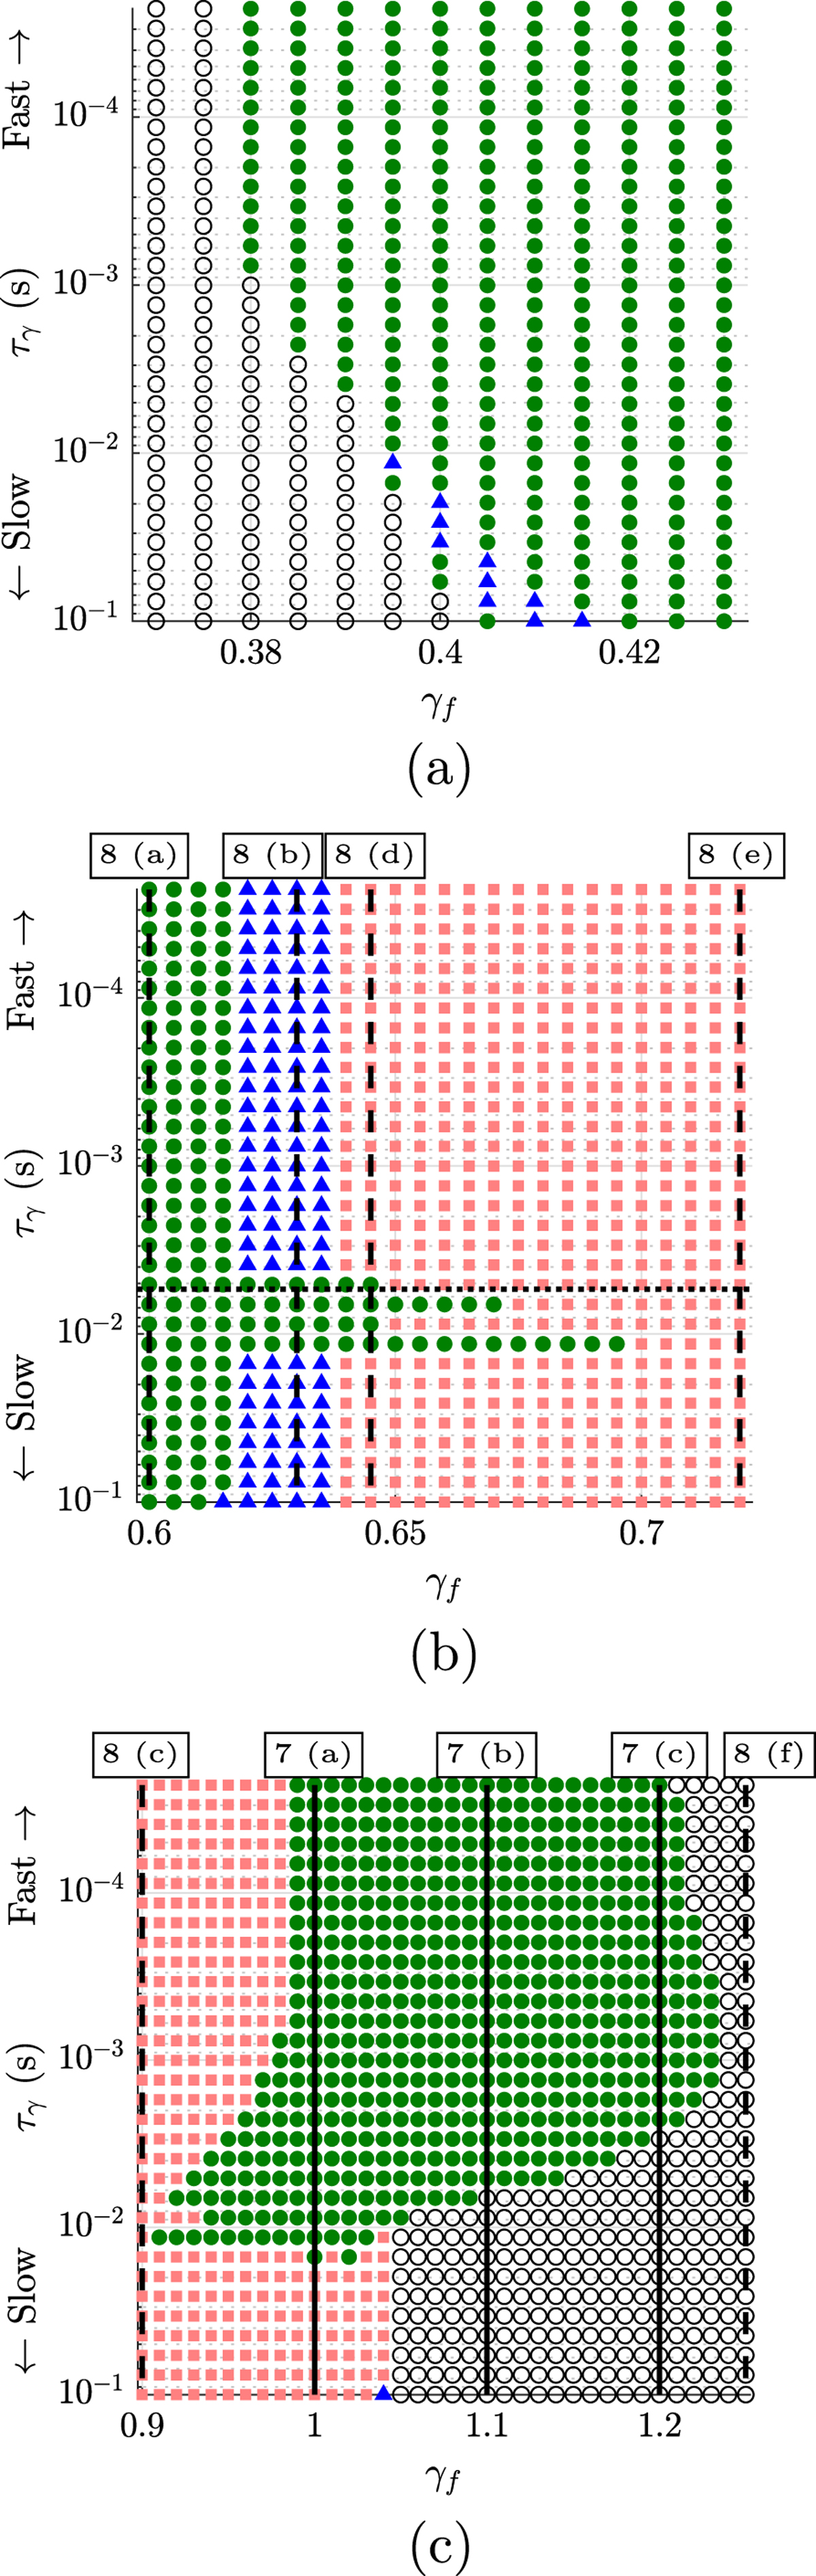
Classification of the steady-state regimes produced depending on the blowing pressure transient parameters: final value γf and characteristic time τg. Multistability zones (deduced from Fig. 3): (a) equilibrium ○ and first register ![]() (b) first register
(b) first register ![]() and second register
and second register ![]() (c) all three regime types. Blue triangles
(c) all three regime types. Blue triangles ![]() indicate quasi-periodic regimes. The horizontal line on graph (b) shows τg= 1/f1. The vertical lines highlight the γ values of phase diagrams in Figures 7 and 8.
indicate quasi-periodic regimes. The horizontal line on graph (b) shows τg= 1/f1. The vertical lines highlight the γ values of phase diagrams in Figures 7 and 8.
Current usage metrics show cumulative count of Article Views (full-text article views including HTML views, PDF and ePub downloads, according to the available data) and Abstracts Views on Vision4Press platform.
Data correspond to usage on the plateform after 2015. The current usage metrics is available 48-96 hours after online publication and is updated daily on week days.
Initial download of the metrics may take a while.