Open Access
Figure 6
Download original image
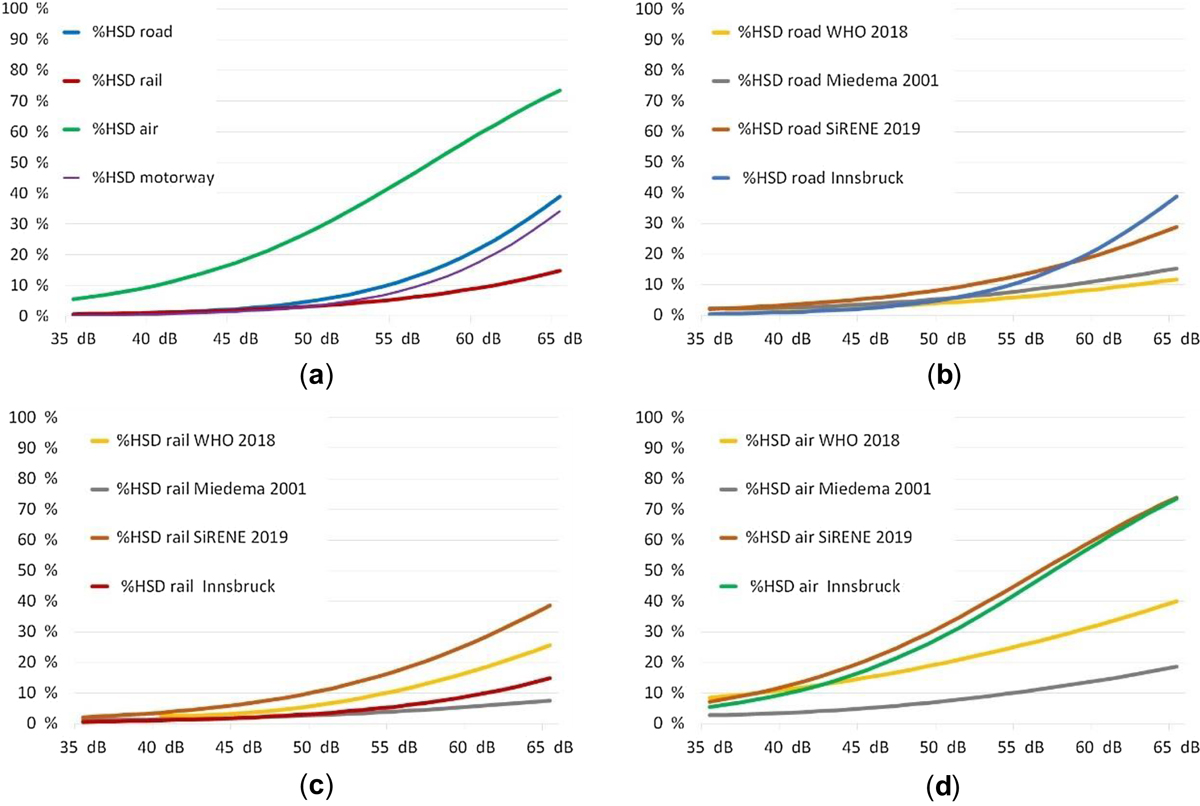
(a) Comparison of exposure-response curves with each other, (b) with WHO 2018, SiRENE 2019 and Miedema 2001 for road, (c) rail and (d) air traffic noise.
Current usage metrics show cumulative count of Article Views (full-text article views including HTML views, PDF and ePub downloads, according to the available data) and Abstracts Views on Vision4Press platform.
Data correspond to usage on the plateform after 2015. The current usage metrics is available 48-96 hours after online publication and is updated daily on week days.
Initial download of the metrics may take a while.