| Issue |
Acta Acust.
Volume 5, 2021
|
|
|---|---|---|
| Article Number | 12 | |
| Number of page(s) | 12 | |
| Section | Environmental Noise | |
| DOI | https://doi.org/10.1051/aacus/2021005 | |
| Published online | 25 February 2021 | |
Scientific Article
Application of the noise annoyance equivalents model for aircraft, rail and road traffic noise to self-reported sleep disturbance
1
Institute and Clinic for Occupational, Social and Environmental Medicine, LMU University Hospital Munich, 80336 Munich, Germany
2
Office of the Tyrolean Regional Government, Department for Emission, Safety and Sites, 6020 Innsbruck, Austria
3
Independent Researcher, 6020 Innsbruck, Austria
4
University Children’s Hospital Regensburg (KUNO-Clinics), University of Regensburg, Clinic St. Hedwig, 93049 Regensburg, Germany
* Corresponding author: This email address is being protected from spambots. You need JavaScript enabled to view it.
Received:
30
November
2020
Accepted:
24
January
2021
Abstract
Sleep disturbances caused by noise exposure are the most relevant outcome measured in disability adjusted life years (DALYs). In analogy to the combined effects of noise from multiple sources on annoyance, these are also of interest for sleep disorders. The study “Overall Noise Assessment” Innsbruck examined data from 1031 personal interviews. Aircraft, rail and road noise were correlated. To choose participants combined exposures were clustered into small, medium and severely affected living situations. The effect of demographic features, noise sensitivity, access to a silent façade and other factors on self-reported sleep disturbances was investigated applying bivariate analyses. Exposure-response curves and their 95% confidence intervals with cut-off values of 72% for “highly disturbed sleep” were generated and the results were discussed in comparison to recently published curves. Using source-specific exposure-response relationships, an overall model for evaluating sleep disorders was developed based on the “annoyance equivalents model”. The “total sleep disturbance response” shows an accumulative outcome for each source measured. A protective effect of road traffic noise as background noise for air and railroad sources could not be proven. Both the “Total Sleep Disruption Assessment Model” and the “Dominant Source Model” have a Spearman-Rho of 0.3 and are therefore suitable for use in noise assessment.
Key words: Combined noise effects / Sleep disturbance / Transportation noise / Exposure-response relationship / Total Noise Investigation Innsbruck
© C. Lechner et al., Published by EDP Sciences, 2021
 This is an Open Access article distributed under the terms of the Creative Commons Attribution License (https://creativecommons.org/licenses/by/4.0), which permits unrestricted use, distribution, and reproduction in any medium, provided the original work is properly cited.
1 Introduction
Environmental noise is becoming a more and more important public health topic. Environmental noise is considered as a severe environmental issue in Europe [1]. In Austria it is even considered the most urgent environmental issue with regard to the assessment of environmental conditions [2]. Noise has important health-related consequences. The best described outcomes are ischemic heart disease [3], cognitive impairment [4], tinnitus [5], adverse birth outcomes [6], annoyance reactions [7] and sleep disorders [8]. Serious efforts are ubiquitous in Europe for monitoring, assessment and mitigation [9]. For each outcome, based on exposure-response relationships, exposure distributions, background prevalence of disease and disability weights, the burden of disease in form of disability adjusted life years (DALYs) has been published. The WHO estimates the loss of DALYs from environmental noise to be 61 000 years for ischemic heart disease, 45 000 years for cognitive impairment in children, 903 000 years for sleep disorders, 22 000 years for tinnitus and 654 000 years for annoyance for the Member States of the European Union and other Western European countries [10].
The highest number of affected people is reported for noise annoyance with a disability weight (DW) of 0.02 and DALYs of 654 000. Less people are affected by sleep disturbance but, due to the higher DW of 0.07, the DALYs are higher at 903 000. Most of the studies explored the effect of single noise sources on annoyance or sleep disturbance. The legal regulations therefore also assess source by source although the need for an overall noise assessment has increased in recent years. The cumulative effects of multiple noise sources need to take into account. The term “overall noise assessment” is mainly related to traffic-related sources. In real life, the various mixtures of rail, aircraft and road noise often dominate our sound environment.
Different models such as the “dominant source model” [11] or the “annoyance equivalents model” [12] were developed and evaluated [13] to assess the “overall noise annoyance” caused by multiple transportation noise sources. The main approaches used to investigate the effects of noise are laboratory and field studies. Whilst most of the studies on noise annoyance are field studies, sleep disorders are frequently investigated in laboratory situations [8].
As far as laboratory studies are concerned, there are results for effects from several sources. Basner et al. [14] showed that aircraft, rail and road noise affect in different ways subjective and objective assessments of sleep and each extra source of noise raised the frequency of noise induced awakenings and/or arousals. The authors point out the need for field studies to validate their results in a setting with higher ecologic validity.
To the best of our knowledge, the health effects of combined noise sources from railway and street traffic on sleep disorders have been assessed in a study based from Bodin et al. [15]. They investigated the combined effect of noise on annoyance using the dominant source model and LAeq,24h but had no such model for sleep disturbance.
A field study from Montreal [16] delivers a quantitative guess of the association between total environmental noise levels estimated using a land use regression (LUR) model and sleep disturbance from transportation noise. In this estimate, sleep disturbance grew with proximity to transportation noise sources (air, rail, and road traffic) and with increasing Lnight values. Two exposure metrics were used – the distance to each transportation noise source and the total ambient noise levels. Log-binomial regressions for the single transportation noise sources and for combinations of road and aircraft as well as road and railway were provided.
While Miedema introduced the “annoyance equivalent model” [12], he has not described a corresponding “sleep disturbance equivalents model”. Nevertheless, the same model is recommended in a German guideline [17] for total sleep disturbance. For application, this model needs an ecologic validation in a field study. Verifying the evidence on ambient noise and annoyance, sleep disturbance, cardiovascular and metabolic health outcomes related to the “Interdepartmental Group on Costs and Benefits Noise Subject Group” ICGB [18], van Kamp et al. suggest a meta-analysis for self-reported sleep disturbance for the combination of all transport sources. To close this gap, secondary data from the project “Total Noise Investigation Innsbruck” [19] were used for this study.
While in an article from 2019 [20] the cumulative effects on annoyances were investigated, an overall sleep disturbance model is introduced in this article. The research question to be answered was: Is the noise annoyance equivalents model for multiple sources also applicable to subjective reported sleep disturbance?
2 Materials and methods
2.1 Design and sample
This study is based on the results of the project “Total Noise Investigation Innsbruck” [19] and on the already published results [20]. The Austrian city of Innsbruck 132 000 inhabitants, is an agglomeration according to the “Environmental Noise Directive” (END) [9]. The town therefore has to perform “strategic noise mapping” for all transportation noise sources, not only the major ones. It is a typical inner alpine city with mountainous surroundings located at the river Inn, which gives its name to the city. While the city center shows an urban characteristic, the outer districts are more rural. A motorway and a major railway cross the town and have a junction at the Brenner Pass in the South. Innsbruck Airport operated around 35 000 flight movements per year in pre-Corona times. A light-rail system exists for the inner-city public transport. Data of the latest micro-census, show that the citizens are burdened from all three noise sources [2]. In the context of noise mapping in 2017 and more recent exposure data calculations, we carried out a combined noise analysis. We chose a cross-sectional study design with face to face interviews and a sample number of 1000 persons [19]. The sampling was executed according to demographic representativeness (age group, gender), distribution within the 9 districts of Innsbruck (number of inhabitants) and classification according to 3 classes of exposure to road traffic, railway and air transport. In doing so, we ended up with 9 exposure groups for random sample selection. These noise exposure groups were ranked by using Lden (<45, 45–55, >55 dB). The face-to-face interviews were performed between 16th May and 8th July 2017 by 23 interviewers specially trained in the noise thematic. People’s life behavior and schedules were considered by varying the interview times. The “Institute for Market Research and Data Analysis – IMAD” performed the interviews.
2.2 Resources and tools
2.2.1 Exposure
Noise exposure prediction was performed referring to the “Environmental Noise Directive” and its legal application in Austria [21]. The entire city, including buildings, was modelled based on the laser scan (2012–2015) [22], according to national requirements [23].
Information about the local road network in Innsbruck and information on traffic flows were derived from the Innsbruck traffic model calibrated by data from permanent vehicle counting stations and additional manual sampling counts. The Austrian highway company ASFINAG supported data from the traffic flow on the motorways derived.
The Austrian railroad company ÖBB provided all relevant data from the rail network in the study area, including the quantity of trains by individual railroad type and noise barriers.
All radar flight data of aircrafts arriving and departing from Innsbruck airport were converted into emission lines for separate sound prediction for each movement, summed up for the whole year.
Sound prediction was referred to the year 2015 by using national temporary approaches for road traffic noise [24] and rail traffic noise [25]. Air traffic noise was computed using the common noise assessment method [26].
We performed additional noise measurements to demonstrate the accuracy of the sound prediction [19].
2.2.2 Questionnaire
The questionnaire for the total noise investigation focused on exposure, annoyance and sleep disturbance from transportation noise sources. Items and scales were applied using the recommendations of the “International Commission on Biological Effects of Noise” (ICBEN) [27, 28], the “Community Statistics on Income and Living Conditions” (EU-SILC 2015) [29], the “Noise Sensitivity Questionnaire” (LEF-K) [30], the 5-item scale for sleep disturbance and the national micro-census “Environmental Conditions” [2]. Pieces from similar projects like NORAH [31] and former own research [32] were converted. Common socio-demographic items were gathered as described in Supplement File 1.
2.2.3 Ethical aspects and data protection
Each study object signed an informed consent form. Research permissions was obtained by the University Research Committee for Scientific and Ethical Questions (RCSEQ) at UMIT. The RCSEQ decided that since no personal sensitive data is processed in this research project (retrospective analysis of anonymized data), a RCSEQ vote is not required. Data protection fulfils all legal requirements of the “General Data Protection Regulation” [33].
2.3 Statistical analyses
The methods used for the statistical analyses were the same as used in the already published “total noise annoyance model” [19, 20]. Descriptive statistics and univariate evaluations were applied. Non-parametric methods like the Mann–Whitney U test and the Chi-squared test were applied. Applying univariate analysis covariates for logistic regression were selected. For focused selection of covariates, every variable with a significant univariate test (p-value < 0.1) was chosen as a parameter for the multivariate analysis. Based on the Wald method from logistic regression, the model was iteratively reduced [34].
Source-specific exposure-response curves on the percentage of highly sleep disturbed people for the noise indicator Lnight were calculated with binary logistic regression analysis in a generalized linear model (GLM).
To measure the effect on the precise noise sleep disturbance of single noise sources, linear regression analyses were calculated by using T-tests.
For developing a “total noise assessment model” for sleep disturbance exposure, response curves for sleep disturbance by nighttime noise exposure were calculated. This was done by use of Lnight and the response on sleep disturbance scale. The curve fit was calculated using a polynomic function of 2nd order without a constant term. As introduced by Miedema in his “annoyance equivalents model” [12], the model is based on equally sleep disturbing road traffic levels for air traffic and for rail traffic.
3 Results
3.1 Representativeness, reliability and descriptive analysis
The reply quote uttered as the ratio of completed interviews to the amount of encountered potential people fitting in the cluster sample achieved 47.8%. The ratio female/male in Innsbruck is 51.3%/48.7% [35]. The survey distribution of 52.5/47.5 shows a deviation of 1.2%.
In each of the 9 noise corridors given by exposure groups of air, rail and road traffic noise at least 111 complete interviews were achieved successfully [20].
Statistical reliability tests were conducted as shown in Supplement File 1.
Some of the descriptive statistics are summarized in Table 1 below. All comprehensive descriptive data are published in an extensive report accessible to the public [19].
Descriptive statistics for the main parameters.
The distributions of the participants due to different nightly noise sources are shown by histograms in each noise band in Figure 1.
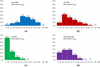 |
Figure 1 (a) Distribution of 1031 participants by noise exposure in nighttime in 5 dB Lnight bands from road traffic noise, (b) rail traffic noise, (c) air traffic noise and (d) motorway noise. |
The Supplementary Material contains noise maps indicating the Lnight for road traffic noise (Fig. S1), rail traffic noise (Fig. S2), air traffic noise (Fig. S3) and motorway noise (Fig. S4). Sleep disturbance caused by different sources and its distribution is shown in Figure 2 grouped in “not or slightly sleep disturbed”, “moderately sleep disturbed” and “highly sleep disturbed”. Road traffic was the dominant noise source, for example shows 76.8% of the recipients not or only slightly sleep disturbed, 17.8% are moderately sleep disturbed and 5.5% are highly sleep disturbed.
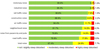 |
Figure 2 Distribution of sleep disturbance from multiple causes according to the grade of disturbance. |
3.2 Covariates in the logistic regression
Table 2 shows the results of the selection process for given variables on the responses on total noise induced sleep disturbances.
Univariate correlation to total sleep disturbance for “highly sleep disturbed” and “sleep disturbed”.
According to the inclusion criteria (p < 0.1) marked in bold, the final logistic regression model for the dichotomous highly sleep disturbed included the noise indicators of all three sources, gender, age2, self-reported noise sensitivity, educational level, access to a quiet façade and the existence of noise prevention windows. Ownership and age were eliminated because they show up only within the sleep disturbed and not within the highly sleep disturbed group.
Table 3 shows the results of the binary logistic regression – generalized model with all interaction terms. There were no significant results for all interaction terms regarding individual noise sources including the interaction terms for all background noise combinations.
Binary logistic regression – generalized model with all interaction terms.
Furthermore, the contribution of the specific sleep disorder scores of the individual noise sources to the overall noise sleep disorder was examined. A linear regression model was used for this. All annoyance scores for noise sources, age, gender, level of education and subjective assessment of noise sensitivity were included as covariates (listed in Tab. 4).
Linear regression analyses – score of total sleep disturbance.
Figure 3 summarizes the effect sizes and significance of the variables in this model.
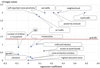 |
Figure 3 Significance and effect size of the variables in the linear regression model and level of significance p = 0.05 (red line), p-values < 0.001 are shown by a −10 log (p-value) of 3. |
3.3 Source-specific exposure – response relationship for transportation noise sleep disturbance
Using a GLM, a logistic regression analysis was performed to evaluate the exposure-response relationship of dichotomous sleep disturbance responses from single exposure to air, rail and traffic. The exposure-response curves were adjusted for self-reported noise sensitivity, access to a quiet façade, and existence of noise control windows. The exposure to road traffic noise ranged from 15 to 63 dB Lnight,road (M = 45.58, Std = 7.46). The exposure to railway noise ranged from 11 to 63 dB Lnight,rail (M = 38.03, Std = 7.55). The range of exposure to aircraft noise covered 8–48 dB Lnight,air (M = 27.24, Std = 7.46), where M is the mean and Std is the standard deviation.
Exposure-response relationship curves for “highly sleep disturbed” at a cut-off value of 72% are shown in Figure 4 for all traffic noise sources by logit functions.
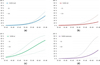 |
Figure 4 (a) Exposure response relationships and their confidence intervals for the percentage of highly sleep disturbed for road, (b) rail and (c) air traffic noise, and (d) for the subgroup motorway noise. |
3.4 Total sleep disturbance assessment model for transportation noise
In [20] we analyzed which polynomic curves to identify the optimal annoyance equivalents model. It was shown that a polynomic function of 2nd order without a constant term was best. The quadratic function provided a considerably improved fit for the general model related to the linear approximation used in Miedema’s model [36]. This is also in line with the German standard [17]. For the purpose of a sleep disturbance model with multiple sources we chose the same approach defined by SD = β1 × Lnight + β2 ×  .
.
The regression was conducted by a GLM by using the same adjusting covariates as used for the logit function for the exposure-response curves.
Figure 5 shows the fitting curves for the scale for annoyance by aircraft, rail, and road noise.
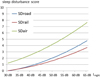 |
Figure 5 Sleep disturbance by transportation noise sources – fitting curves for the individual data points (11-point scale). |
The results of the regression analyses by GLM for the quadratic model are shown below (see Tab. 5).
Regression coefficients for curve fit by quadratic model without constant.
Using the results of Table 5, the expected sleep disturbance scores caused by aircraft, rail and road noise were calculated by the following formulas:
 (1)
(1)
 (2)
(2)
 (3)
(3)
Results for expected sleep disturbance scores < 0 were converted to 0. The estimated results are correlated with the prearranged survey sleep disturbance scores. Subsequently, predicted scores  and
and  were converted to the corresponding exposure of road traffic noise Lnight,road. This was done using the quadratic equation for
  to obtain the substitution levels
  and
and  .
.
 (4)
(4)
 (5)
(5)
To obtain the substitution level for the total noise  , the substitution levels for rail traffic noise
  and air traffic noise
  and the level of road traffic noise Lnight,road are added up according to the acoustic rules for the sum of levels using the following formula:
 (6)
(6)
In the same way, a total sleep disturbance score  is obtained from
  by using the equation for road traffic noise as:
 (7)
(7)
The estimated sleep disturbance score  derived from the substitution level of all noise sources
  was correlated with the survey result SDtotal. Same procedure was applied for each single source (air, rail and road traffic). The results of the non-parametric tests are shown in Table 6.
Correlation coefficients for different models and single sources.
The equivalents model shows a correlation coefficient of 0.300 as well as the dominant source model. The correlation coefficients for each single source are in a comparable dimension: 0.329 for road, 0.378 for rail and 0.295 for air traffic noise.
4 Discussion
4.1 Covariates in the model
Variables are sometimes not substantially related to the result but may contribute in the presence of other variables. Purposeful selection [34] was helpful in identifying covariates. As shown in Table 4, there is a difference as to whether the outcome is “highly sleep disturbed” or “sleep disturbed”. While for “highly sleep disturbed” the night noise indexes for road and air, but not for rail traffic noise, are significant, for “sleep disturbed” all three noise sources are significant. This could likely be due to the smaller number of respondents in the “highly sleep disturbed” group.
According to the results by Van Gerven et al. [36], age was included into our analyses as a linear covariate and as a quadratic term as well. The epidemiological covariates age (age squared) and gender meet the inclusion criteria for the covariate selection process. Self-reported noise sensitivity, educational level, access to a quiet façade and installation of special noise insulations (noise protection windows) met the inclusion criteria in both categories “highly sleep disturbed” and “sleep disturbed”. Self-reported health status, the fact of owning the residence, and numbers of children in the household had no significant influence.
The binary logistic regression results, although they included interaction terms, are not usable. Table 5 shows no significant contribution of noise indicators, neither of the three sources, nor of the interaction between these indicators. The only significant covariates are gender, age2, subjective sensitivity to noise, educational level and the fact that noise protection windows were installed within the last 10 years. This leads to the conclusion that a binary construction of a total noise sleep disturbance model is not feasible. There is a big difference in whether a response on the 11-point scale is 0 or 7, or if it is 8 or 10. These differences are not considered in a binary model with a cut-off value, in our case at 72% for “highly sleep disturbed”. The linear regression model avoids this disadvantage.
An increased of the total sleep disturbance score occurs for each transportation noise source that is significant. All other non-modelled sources show the same positive effect, except sleep disturbance from craft and industry noise as well as noise caused by construction sites. This could be explained by the characteristic occasions of these sources. The character of industrial sounds, containing tonal or impulsive components or dominant low frequencies, may provide another explanation. Access to a quiet façade and noise protection windows installed within the last 10 years were significant variables. While age2 contributes significantly, gender and educational level were clearly not significant.
Subjectively, reported noise sensitivity has a strengthening effect on total sleep disturbance as also observed in other studies on total annoyance [11, 20].
4.2 Comparison with other study results
The exposure-response relationships compared to the recently published SiRENE study (Switzerland) [37]. A meta-analysis by Basner and McGuire [7, 8] was the basis for WHO 2018 recommendations [38]. These new publications used comparable exposure estimation tools to this study methodology (Fig. 6).
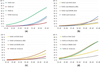 |
Figure 6 (a) Comparison of exposure-response curves with each other, (b) with WHO 2018, SiRENE 2019 and Miedema 2001 for road, (c) rail and (d) air traffic noise. |
The different transportation noise sources cause very different self-reported sleep disturbance reactions. The response on air traffic noise in nighttime is much higher than on road and rail traffic noise. The curves for road and rail traffic noise are close together until 50 dB Lnight. Above 50 dB, there is a strong raise in the percentage of “highly sleep disturbed” while the response curve for rail traffic noise is much flatter. A percentage of 10% “highly sleep disturbed” is expected at 54 dB Lnight road traffic noise and 61 dB rail traffic noise. This means a shift of 7 dB within this range. In contrast to the annoyance results [20], it seems that there is still a “railway bonus” for self-reported sleep disturbance. The sleep disturbance on motorway noise is slightly lower than on overall road traffic noise. There is a curve shift of 2–3 decibels between 50 and 65 dB. The exposure-response curve of Innsbruck fits well for road noise up to 50 dB Lnight with the recent WHO curves [38] and the Miedema curves [39] that run closely together. The WHO recommended threshold level of 3% “highly sleep disturbed” [38] is reached at 46 dB as well in Innsbruck as in the WHO curves [38]. The Innsbruck curve lies between the SiRENE and the WHO curves up to 58 dB Lnight. Above 58 dB in Innsbruck, the highest sleep disturbance response compared to the others is observed. Self-reported sleep disturbance caused by rail traffic noise in Innsbruck shows responses between the Miedema curves [39] and the recent WHO curves [38]. This means that the observed effect is much lower than published in the “Environmental Noise Guidelines for the European Region” [38]. The WHO recommended threshold of 3% “highly sleep disturbed” is reached at 49 dB Lnight, which is 5 dB higher than the corresponding value in the WHO guidelines. As a contradiction, the SiRENE results show much higher reactions on sleep disturbance. The exposure response function for air traffic noise in Innsbruck is remarkably close to the one of SiRENE. Both curves are higher than the recent WHO curve. In the full range, beginning from 35 dB Lnight, the WHO recommended threshold level for health effects of 3% “highly sleep disturbed” is exceeded. The reasons for these higher reactions cannot be derived from the data themselves. One reason could be the special alpine topography. Another aspect is the exposure assessment of the loudest façade. In the case of aircraft noise, the differences between loud and quiet façades are far smaller than in the case of road and rail traffic sources. Both circumstances apply to the SiRENE study and the Total Noise Investigation in Innsbruck.
The exposure response relationships for motorway and air traffic noise show a wide range for the 95% confidence intervals. The reason for this is the small number of interviewees at higher exposure levels. There is no reason to fear a negative impact when applying an equivalence model in practice, since noise protection measures are already initiated for each individual source in exposure areas above Lnight 55 dB. Higher levels should be outside the scope of this model.
4.3 Total sleep disturbance assessment model for transportation noise
A model for evaluating sleep disorders must be suitable not only for all combinations of sources, but also for each individual source in order to be legally applicable. A single value should express the degree of sleep disturbance caused by each combination so that it can be compared with a threshold value.
Regardless of the source or source combination, this threshold value indicates a certain probability of sleep disorder. A sleep disorder is evaluated by a noise index if only one singular source is relevant for the recipient. On the 11-point sleep disorder scale, there is a difference of 2 points or more between air traffic noise and road, as well as rail traffic, noise (Fig. 5). A singular physical model, where noise levels are logarithmically summed, does not meet the requirements for each individual source rating. The physical noise level recorded for aircraft noise would result in the same sleep disturbance value for the other two sources. For this reason, the physical summation approach was not further investigated.
In an analytical continuation of our study on combined effects on annoyance [20], we tested the validity of an equivalents model and it is obvious that this approach came up with valid results. Spearman’s Rho for the sleep disturbance model was predicted with 0.300 (p value 0.000 is significant at the 0.01 level 2-tailed). In comparison to this, the dominant source model shows the same correlation with 0.300. If the self-reported sleep disturbance is applied only to the most disturbing source, i.e. the dominant source, Spearman’s Rho is 0.737. A possible reason may be the level-time structure. While all noise impacts are perceived during the day simultaneous or sequentially, the difficulty falling asleep and waking up reactions are more important in rating sleep disturbance. This is caused by late evening and early morning flights as well as the local light-rail trains. These disorders may then focus on this single source. This supports the dominant source model. Not only transportation noise sources contribute to the total sleep disturbance outcome. Other important sources of noise come from passers-by, pubs with outdoor bar areas, and general noise in the neighborhood. Understandably, the correlation is therefore not so high compared to the disturbance response to a single noise source. However, with Spearman’s Rho of 0.300, it is still within a well-known range of correlation in noise impact research [40].
The used noise index Lnight is based on an equivalent noise level. Griefahn et al. showed [41] that this seems to be a suitable predictor for the subjectively assessed sleep quality. Bodin et al. [15] show a concise correlation between transportation noise from road and rail, or the combination of the two noise sources, sleep problems. In our study, this relationship is extended to all three transportation noise sources and their combinations. This is also consistent with the results of Perron et al. [16] which provide a quantitative estimate of the relationship between the total ambient noise level estimated using a LUR model and sleep disturbance from transport noise.
Noise assessment in environmental impact assessments in Austria should in principle consider background noise. The higher the background exposure, the higher the additional exposure is allowed based on a masking effect. For aircraft noise and rail traffic noise it is of interest whether road traffic as background noise has a protective or strengthening influence on overall noise annoyance as well as on overall self-reported sleep disturbance. The results do not prove a protective effect of road traffic noise.
4.4 Strengths and limitations
A strength of this study was the study design and the study concept, which allowed the combined effects of several sources to be evaluated. A further strength is the survey instrument of the personal interviews and the remarkably high response rate of 47.8%. These facts increase the representativeness and validity of our results. Applying state-of-the-art sound propagation methods for exposure assessment and considering each flight movement, all streets down to access roads, and each train passing by is another strength. Before carrying out the survey, the exposure at each building façade was rated with full accuracy. This is significantly better than classification into noise bands.
Due to the high response rate and the cluster selection of 1031 participants by age, gender, district and noise exposure, the selection bias is considered low.
Our study also has several limitations. Similar to other studies, the determination of noise exposure was based on the level of the most exposed façade. In many cases, this façade is not representative for people who have bedrooms facing quiet façades. Since there can be considerably high differences in exposure of rail traffic noise and road traffic noise between the most exposed façade and the quiet façade, this leads to an underestimation of the effect of self-reported sleep disturbance in the population. As multiple sources are considered in the overall sleep disturbance model, the most exposed façade for different sources differs source by source. The study shows the exposure and response situation in an urban area. Transferring the results into other settings like rural areas should only be performed with caution.
5 Conclusions
A sleep disturbance equivalents model for multiple transportation noise sources is suitable for estimating total sleep disturbance within the same range as the annoyance equivalents model. The same fit can also be achieved by using a dominant source model. In this case, it is especially important to rate according to the most sleep disturbing source – not the loudest source. Air traffic noise in nighttime causes much higher sleep disturbances than the other transportation noise sources, i.e. road and railway. Compared to the results of the meta-analyses of the WHO, it is worth deriving local exposure response functions to set noise limits by using the recommended thresholds for health outcomes.
Supplementary materials
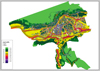 |
Figure S1: Noise map Lnight for road traffic noise. |
 |
Figure S2: Noise map Lnight for rail traffic noise. |
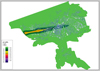 |
Figure S3: Noise map Lnight for air traffic noise. |
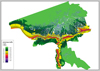 |
Figure S4: Noise map Lnight for motorway noise. |
File S1: Questionnaire core Areas, contents and reliability test results, values of the exposure response curves and their confidence intervals. Access Supplementary Material
Author contributions
C.L. and D.S. designed the survey; C.L. acquired funding; D.S. developed the instruments, organized the survey and elaborated descriptive analysis; C.L. was responsible for the modelling of all acoustical data; C.L. analyzed the acoustical and survey data on combined noise effects and wrote the paper; S.B.-O. was supervising and did substantive evaluation of the manuscript. All authors read and approved the final manuscript.
Funding
This research was undertaken in addition and based on the project “Gesamtlärmbetrachtung Innsbruck” (Total Noise Investigation Innsbruck) conducted by the State of Tyrol. The Infrastructure Carriers (named in alphabetical order) ASFINAG (Austrian Motorway Finance Corporation), ÖBB (Austrian Railway Company), Innsbruck Airport in addition to the provision of traffic data as well as the state of Tyrol, the city of Innsbruck and the Austrian Association for Noise Abatement have also made financial contributions to the realization of the pilot project “Gesamtlärmbetrachtung Innsbruck” (Total Noise Investigation Innsbruck)” (Lechner and Schnaiter, 2018).
Conflicts of interest
The authors declare no conflict of interest.
Acknowledgments
The authors would like to thank all the funding institutions for their contributions. Many grateful thanks to Marjan Arvandi for her support in statistical matters, Roland Gogl for his efforts in modelling noise data and Nicole O’Reilly and Ian Dilworth for their support as English native speakers.
References
- European Environment Agency: Noise in Europe 2014. Publications Office of the European Union, Luxembourg, 2014. [Google Scholar]
- S. Baud: Umweltbedingungen, Umweltverhalten 2015 [Environmental Conditions, Environmental Behavior 2015]. Statistik Austria, Wien, 2017. [Google Scholar]
- E. van Kempen, M. Casas, G. Pershagen, M. Foraster: WHO environmental noise guidelines for the European region: A systematic review on environmental noise and cardiovascular and metabolic effects: A summary. International Journal of Environmental Research and Public Health 15 (2018) 1–59. [Google Scholar]
- C. Clark, K. Paunovic: WHO environmental noise guidelines for the European region: A systematic review on environmental noise and cognition. International Journal of Environmental Research and Public Health 15 (2018). [Google Scholar]
- M. Śliwińska-Kowalska, K. Zaborowski: WHO environmental noise guidelines for the European region: A systematic review on environmental noise and permanent hearing loss and tinnitus. International Journal of Environmental Research and Public Health 14 (2017). [Google Scholar]
- M. Nieuwenhuijsen, G. Ristovska, P. Dadvand: WHO environmental noise guidelines for the European region: A systematic review on environmental noise and adverse birth outcomes. International Journal of Environmental Research and Public Health 14 (2017) 1252. [Google Scholar]
- R. Guski, D. Schreckenberg, R. Schuemer: WHO environmental noise guidelines for the European region: A systematic review on environmental noise and annoyance. International Journal of Environmental Research and Public Health 14 (2017) 1539. [Google Scholar]
- M. Basner, S. McGuire: WHO environmental noise guidelines for the European region: A systematic review on environmental noise and effects on sleep. Int. J. Environ. Res. Public Health 15 (2018) 1–39. [Google Scholar]
- The European Parliament and the Council of the EU: Directive 2002/49/EC of the European Parliament and of the Council Relating to the Assessment and Management of Environmental Noise. Off. J. Eur. Communities, Bruxelles, 2002, pp. 12–25. [Google Scholar]
- World Health Organization: Burden of Disease From Environmental Noise: Quantification of Healthy Life Years Lost in Europe. World Health Organization, Regional Office for Europe, Copenhagen, 2011. [Google Scholar]
- J. Wothge, C. Belke, U. Möhler, R. Guski, D. Schreckenberg: The combined effects of aircraft and road traffic noise and aircraft and railway noise on noise annoyance – An analysis in the context of the joint research initiative NORAH. International Journal of Environmental Research and Public Health 14 (2017) 871. [Google Scholar]
- H. Miedema: Relationship between exposure to multiple noise sources and noise annoyance. The Journal of the Acoustical Society of America 116 (2004) 949–957. [PubMed] [Google Scholar]
- L.A. Gille, C. Marquis-Favre, K.C. Lam, P. Cedex, C. Marquis-Favre, J. Morel, P. Lercher, B. De Coensel, L. Dekonink, D. Botteldooren: Annoyance due to combined railway and road traffic noise exposure : Testing of total annoyance models and dose-effect relationships for noise in isolation. International Journal of Environmental Research and Public Health 14 (2017) 663. [Google Scholar]
- M. Basner, A. Samel, E.M. Elmenhorst, H. Maab, U. Müller, J. Quehl, M. Vejvoda: Single and combined effects of air, road and rail traffic noise on sleep, in Inst. Noise Control Eng. USA – 35th Int. Congr. Expo. Noise Control Eng. INTER-NOISE Vol. 7 (2006), pp. 4629–4637. [Google Scholar]
- T. Bodin, J. Björk, J. Ardö, M. Albin: Annoyance, sleep and concentration problems due to combined traffic noise and the benefit of quiet side. International Journal of Environmental Research and Public Health 12 (2015) 1612–1628. [PubMed] [Google Scholar]
- S. Perron, C. Plante, M.S. Ragettli, D.J. Kaiser, S. Goudreau, A. Smargiassi: Sleep disturbance from road traffic, railways, airplanes and from total environmental noise levels in montreal. International Journal of Environmental Research and Public Health 13 (2016). [Google Scholar]
- Verein Deutscher Ingenieure: Wirkung von Verkehrsgeräuschen, Kenngrößen beim Einwirken mehrerer Quellenarten. VDI 3722 - Blatt 2, Düsseldorf, 2013. [Google Scholar]
- I. van Kamp, E. van Kempen, S. Simon, C. Baliatsas: Review of Evidence Relating to Environmental Noise Exposure and Annoyance, Sleep Disturbance, Cardio-Vascular and Metabolic Health Outcomes in the Context of ICGB(N). RIVM – National Institute for Public Health and the Environment, Bilthoven, 2019. [Google Scholar]
- C. Lechner, D. Schnaiter: Gesamtlärmbetrachtung Innsbruck 2017 [Total Noise Assessment Innsbruck 2015].Amt der Tiroler Landesregierung, Innsbruck, 2018. [Google Scholar]
- C. Lechner, D. Schnaiter, S. Bose-O’Reilly: Combined effects of aircraft, rail, and road traffic noise on total noise annoyance – A cross-sectional study in Innsbruck. International Journal of Environmental Research and Public Health 16 (2019) 3504. [Google Scholar]
- Bundes-LärmV Bundes-Umgebungslärmschutzverordnung BGBl. II 144/2006 [Federal Environmental Noise Ordinance BGBl. II 144/2006]. Bundesgesetzblatt für die Republik Österreich, Wien, 2006. [Google Scholar]
- Land Tirol: Laserscan Tirol [Airborne Laser Scan by the State Government of the Tyrol], 2013. Available online: https://www.tirol.gv.at/sicherheit/geoinformation/geodaten/laserscandaten/ (Accessed on Apr 21, 2020). [Google Scholar]
- C. Lechner: ÖAL-Richtlinie Nr. 36 Blatt 2, Erstellung von Lärmkarten und Konfliktzonenplänen und Planung von Lärmminderungsmaßnahmen Anforderungen im Anwendungsbereich der Umgebungslärmrichtlinie 2002/49/EG [Noise mapping and conflict zone plans]. Österreichischer Arbeitsring für Lärmbekämpfung, Wien, 2010. [Google Scholar]
- RVS 04.02.11: Lärm und Luftschadstoffe – Lärmschutz [Environmental Protection Noise and Airpollution – Noise Control]. Österreichische Forschungsgesellschaft Straße–Schiene–Verkehr, Wien, 2008. [Google Scholar]
- ONR 305011: Berechnung der Schallimmission durch Schienenverkehr – Zugverkehr, Verschub- und Umschlagbetrieb [Determination of Noise Immission Caused by Rail Traffic – Railway Traffic, Shunting and Cargo Handling Operations]. Österreichische Forschungsgesellschaft Straße–Schiene–Verkehr, Wien, 2009. [Google Scholar]
- ECAC No. 29: Report on standard method of computing noise contours around civil airports, in European Civil Aviation Conference, Neuilly-sur-Seine/Paris, Vol. 29. 1997. [Google Scholar]
- J.M. Fields, R.G. De Jong, T. Gjestland, I.H. Flindell, R.F.S. Job, S. Kurra, P. Lercher, M. Vallet, T. Yano, R. Guski, U. Felscher-Suhr, R. Schumer: Standardized general-purpose noise reaction questions for community noise surveys: Research and a recommendation. Journal of Sound and Vibration 242 (2001) 641–679. [Google Scholar]
- International Institute for Standardization: Acoustics – Assessment of Noise Annoyance by Means of Social and Socio-Acoustic Surveys. ISO/TS 15666, Geneva, 2003. [Google Scholar]
- Statistik Austria: Datenerhebung [Data Collection] EU-SILC 2015. Available online: https://circabc.europa.eu/faces/jsp/extension/wai/navigation/container.jsp (accessed on Jul 31, 2019). [Google Scholar]
- K. Zimmer, W. Ellermeier: Psychometric properties of four measures of noise sensitivity: A comparison. Journal of Environmental Psychology 19 (1999) 295–302. [Google Scholar]
- R. Guski, D. Schreckenberg: Verkehrslärmwirkungen im Flughafenumfeld [traffic noise effects in the airport environment]. Norah Wissen Band 7, Kelsterbach, 2015 (98). [Google Scholar]
- D. Schnaiter: Evaluierungserhebung Neue Unterinntalbahn [Evaluation Survey New Lower Inn Valley Railway]. ÖBB Infrastruktur AG. Executive Summary Available online: https://www.brennernordzulauf.eu/infomaterial.html?file=files/mediathek/informationsmaterial/vertiefende_infos/Neue-Unterinntalbahn-Evaluierung.pdf (Accessed on Apr 21, 2020). [Google Scholar]
- The European Parliament and the Council of the EU: General Data Protection Regulation 2016. Off. J. Eur. Union, Bruxelles, 2016, pp. 1–149. [Google Scholar]
- Z. Bursac, C.H. Gauss, D.K. Williams, D.W. Hosmer: Purposeful selection of variables in logistic regression. Source Code for Biology and Medicine 3 (2008) 1–8. [PubMed] [Google Scholar]
- E. Ammon, M. Behmann: Demografische Entwicklung 2017 [Demografic Developement 2017]. Stadtmagistrat Innsbruck, Innsbruck, 2017. [Google Scholar]
- P.W.M. van Gerven, H. Vos, M.P.J. van Boxtel, S.A. Janssen, H.M.E. Miedema: Annoyance from environmental noise across the lifespan. Journal of the Acoustical Society of America 126 (2009) 187–194. [Google Scholar]
- M. Brink, B. Schäffer, D. Vienneau, R. Pieren, M. Foraster, I.C. Eze, F. Rudzik, L. Thiesse, C. Cajochen, N. Probst-Hensch, M. Röösli, J.M. Wunderli: Self-reported sleep disturbance from road, rail and aircraft noise: Exposure-response relationships and effect modifiers in the SiRENE study. International Journal of Environmental Research and Public Health 16 (2019). [Google Scholar]
- World Health Organization: Environmental Noise Guidelines for the European Region. WHO Regional Office for Europe, Copenhagen, 2018. [Google Scholar]
- H. Miedema, C. Oudshoorn: Annoyance from transportation noise: Relationships with exposure metrics DNL and DENL and their confidence intervals. Environmental Health Perspectives 109 (2001) 409–16. [PubMed] [Google Scholar]
- M. Brink: A review of explained variance in exposure-annoyance relationships in noise annoyance surveys, in 11th International ICBEN Congress on Noise as a Public Health Problem, Nara. 2014. [Google Scholar]
- B. Griefahn, A. Marks, S. Robens: Noise emitted from road, rail and air traffic and their effects on sleep. Journal of Sound and Vibration 295 (2006) 129–140. [Google Scholar]
Cite this article as: Lechner C, Schnaiter D & Bose-O’Reilly S. 2021. Application of the noise annoyance equivalents model for aircraft, rail and road traffic noise to self-reported sleep disturbance. Acta Acustica, 5, 12.
All Tables
Univariate correlation to total sleep disturbance for “highly sleep disturbed” and “sleep disturbed”.
All Figures
|
Figure 1 (a) Distribution of 1031 participants by noise exposure in nighttime in 5 dB Lnight bands from road traffic noise, (b) rail traffic noise, (c) air traffic noise and (d) motorway noise. |
| In the text | |
|
Figure 2 Distribution of sleep disturbance from multiple causes according to the grade of disturbance. |
| In the text | |
|
Figure 3 Significance and effect size of the variables in the linear regression model and level of significance p = 0.05 (red line), p-values < 0.001 are shown by a −10 log (p-value) of 3. |
| In the text | |
|
Figure 4 (a) Exposure response relationships and their confidence intervals for the percentage of highly sleep disturbed for road, (b) rail and (c) air traffic noise, and (d) for the subgroup motorway noise. |
| In the text | |
|
Figure 5 Sleep disturbance by transportation noise sources – fitting curves for the individual data points (11-point scale). |
| In the text | |
|
Figure 6 (a) Comparison of exposure-response curves with each other, (b) with WHO 2018, SiRENE 2019 and Miedema 2001 for road, (c) rail and (d) air traffic noise. |
| In the text | |
|
Figure S1: Noise map Lnight for road traffic noise. |
| In the text | |
|
Figure S2: Noise map Lnight for rail traffic noise. |
| In the text | |
|
Figure S3: Noise map Lnight for air traffic noise. |
| In the text | |
|
Figure S4: Noise map Lnight for motorway noise. |
| In the text | |
Current usage metrics show cumulative count of Article Views (full-text article views including HTML views, PDF and ePub downloads, according to the available data) and Abstracts Views on Vision4Press platform.
Data correspond to usage on the plateform after 2015. The current usage metrics is available 48-96 hours after online publication and is updated daily on week days.
Initial download of the metrics may take a while.