| Issue |
Acta Acust.
Volume 10, 2026
|
|
|---|---|---|
| Article Number | 15 | |
| Number of page(s) | 17 | |
| Section | Environmental Noise | |
| DOI | https://doi.org/10.1051/aacus/2026009 | |
| Published online | 06 March 2026 | |
Technical & Applied Article
Road noise in Europe: The case for transparent and standardised data presentation
1
University of Galway and Ryan Institute, University of Galway, University Road, Galway H91 TK33, Ireland
2
Malone O’Regan Environmental Services, Bracken Business Park, Ground Floor – Unit 3, Bracken Rd, Sandyford D18 V32Y, Dublin, Ireland
* Corresponding author: This email address is being protected from spambots. You need JavaScript enabled to view it.
Received:
26
September
2025
Accepted:
25
January
2026
Abstract
It has been nearly three decades since the European Commission adopted the Green Paper on Future Noise Policy in 1996, marking a pivotal step towards developing an EU – wide noise policy, ultimately leading in 2002 to the formal adoption of Directive 2002/49/EC, known as the Environmental Noise Directive. The END mandates that the EU Member States develop strategic noise maps and action plans every five years. Since its inception, four rounds of noise mapping and action planning have been completed: the first in 2007, followed by subsequent rounds in 2012, 2017 and 2022. These efforts have systematically assessed environmental noise exposure across Europe, informing action plans aimed at reducing its impacts. A significant evolution in EU noise policy has been the requirement for all EU Member States to use Common Noise Assessment Methods in Europe for their noise mapping activities. Based on mapping results, road traffic continues to be the primary source of environmental noise in urban areas, with millions of individuals exposed to harmful noise levels. Increasing evidence underscores the health risks associated with noise exposure, with studies suggesting that reducing road traffic noise to levels recommended by the World Health Organization could lead to significant improvements in public health outcomes. Despite these concerns, obtaining accurate and comprehensive noise data from Member States remains a persistent challenge. This paper examines the data submitted from EU Member States under the END and identifies critical needs for the future.
Key words: Environmental noise directive / Strategic noise map / Noise action plan / Policy / Exposure
© The Author(s), Published by EDP Sciences, 2026
 This is an Open Access article distributed under the terms of the Creative Commons Attribution License (https://creativecommons.org/licenses/by/4.0), which permits unrestricted use, distribution, and reproduction in any medium, provided the original work is properly cited.
1 Introduction
It has been more than 25 years since the European Commission (EC) adopted the Green Paper on Future Noise Policy in 1996 [1]. This was the first comprehensive step forward to developing an EU-wide noise polity to ensure that individuals should not be exposed to noise levels that might endanger their health and quality of life, which became a core objective of the Fifth Environmental Action Program. The Green Paper led ultimately to the Environmental Noise Directive (END) [2]. The END’s objective is to establish a framework to assess the extent of environmental noise exposure and define a common approach intended to avoid, prevent or reduce, on a prioritised basis, the harmful effects resulting from exposure. The END sets out a cyclical process where strategic noise maps and noise action plans must be developed and delivered to the Commission every five years. The European Commission’s zero pollution action aims to reduce the number of people chronically disturbed by transport noise by 30% by 2030 [3] compared to 2017 levels. With four rounds of noise mapping now available for evaluation, this study evaluates whether the EU Member States and the use of the END has met its primary objective of reducing the number of Europeans exposed to harmful environmental noise levels. It also examines how EU Member States have made tangible progress in noise mapping, specifically investigating the outcomes of the last two phases of noise mapping to gauge the END’s effectiveness in reducing population exposure to noise. The scope of this study does not extend to assessing any secondary impacts the END may have had on national noise control policies within individual EU Member States. The analysis focuses on data reported by EU Member States as required under the Directive, specifically investigating the percentages of people exposed. Direct comparisons between rounds are not appropriate due to the different reporting thresholds and calculation methods used.
Since its adoption in 2002, Directive 2002/49/EC (END) has undergone three significant amendments. The first, Commission Directive (EU) 2015/996 of 19 May 2015 [4], established common noise assessment methods in accordance with the END. The second, Regulation (EU) 2019/1010 [5] streamlined environmental reporting by aligning schedules, introducing digital platforms, and standardising data presentation. These improvements reduced administrative burdens while enhancing data accessibility and transparency compared to the original Directive. The most recent amendment, Commission Directive (EU) 2020/367 [6], updated Annex III to incorporate World Health Organization’s (WHO) dose-response relationships, improving the assessment of health impacts such as annoyance and sleep disturbance [7]. This update provided a harmonised scientific framework for evaluation the effects of environmental noise on human health. These amendments modernised and standardised noise assessment and reporting process across the EU.
Under the terms of the END [2], strategic noise maps must be developed for major agglomerations, major roads, major railways and major airports. A strategic noise map is defined within the END as “a map designed for the global assessment of noise exposure in a given area due to different noise sources for overall predictions for such an area". Thus, strategic noise mapping is concerned with the practicalities of the noise mapping exercised as well as the assessment of exposure within designated areas [8]. Estimates of the population exposed to different noise levels may then be determined from the results of these strategic noise maps. In this regard, the END requires competent authorities in each EU Member State to estimate the number of people living in dwellings in 5 dB bands of Lden and Lnight separately for road, rail, air and industrial sources. EU Member States are also required to develop noise action plans, which, according to the END, are “plans designed to manage noise issues and effects, including noise reduction if necessary". The END requires that these plans be reviewed every five years once adopted and on an ongoing basis to account for major new developments in designated areas.
CNOSSOS-EU developed by the EC and published as a Directive in July 2015, aims to standardise European noise assessment methods [4]. This comprehensive framework incorporates detailed parameters such as vehicle type distributions, road surface types, and environmental factors to ensure consistency and reliability in strategic noise mapping and action planning.
Before the introduction of CNOSSOS-EU, EU Member States employed a variety of national methods for noise assessment. These methods often differed significantly in their input data, calculation algorithms, and assumptions about noise propagation. Such discrepancies resulted in inconsistencies in noise maps, making it challenging to compare results across countries and assess the broader impact of environmental noise in the EU. Article 6(2) of the END states that “The Commission shall establish common assessment methods for the determination of Lden and Lnight”. Developments to this end were presented in a Joint Research Centre (JRC) reference report in 2012 [9] (describing a method commonly referred to as CNOSSOS-EU), which was later superseded by the publication of the European Commission Directive (EU) 2015/996 [4], representing the legal framework for the implementation of this common assessment method for strategic noise mapping under the END [2].
Thus, the CNOSSOS-EU method was developed through a collaborative effort involving scientific experts, policymakers, and industry stakeholders, with its foundation laid on robust acoustical science and modelling principles. CNOSSOS-EU became the mandatory framework for all EU Member States to address these issues, starting with R4 of noise mapping. Harmonising methodologies should lead to improve the comparability and scientific rigour of European noise assessments. This unified approach will enable EU Member States to evaluate the effectiveness of noise action plans better and align their efforts with the END [2] objectives. Additionally, CNOSSOS-EU facilitates more effective cross-border collaboration and ensures a robust foundation for managing environmental noise at the European level.
In [10], the CNOSSOS-EU model demonstrated a high degree of accuracy in predicting road traffic noise levels in Irish urban environments. The predictions closely aligned with actual noise measurements, indicating the model’s reliability for strategic noise mapping in Ireland.
The findings suggest that the CNOSSOS-EU model is a valuable tool for informing national noise policies and action plans. Its accurate predictions can support policymakers in identifying priority areas for noise-reduction interventions. This report indicates that CNOSSOS-EU performs better than the CRTN model; however, it relies on reference conditions that may not be fully representative of all EU Member States. In particular, limitations in the reference conditions have been identified for rail noise sources [11]. Consequently, country-specific comparisons are required, taking into account national traffic conditions and noise-management practices, with a focus on strategies for noise reduction by 2030.
The European Topic Centre on Air Pollution, Transport, Noise and Industrial Pollution (ETC/ATNI) has compiled the data according to the AP2021/EEA and the specific agreement between EC and EEA. This data has been used in this analysis. In R1, the data corresponded to the data reported on strategy noise mapping, which was due by December 2007. In R2, the data corresponded to data reported on strategy noise mapping, which was due by December 2012. In R3, the data corresponded to data reported on strategy noise mapping, which was due by December 2017.
By 2030, pollution in the EU should be reduced to levels that no longer pose a threat to human health or the environment. This goal, known as the “zero pollution ambition”, is at the core of the Zero Pollution Action Plan [3]. The plan seeks to enhance the EU’s leadership in green, digital, and economic sectors while fostering a healthier and more socially equitable Europe. It serves as a guide for integrating pollution prevention into all relevant EU policies, improving the enforcement of existing legislation, and identifying potential regulatory gaps.
Because of the adoption of a CNOSSOS-EU for all noise sources, data reported in 2022 is not directly comparable with the strategic noise maps corresponding to 2017 (R3), which were developed using national methods. This methodological change introduces a discontinuity between R3 and R4. Therefore, a 2017 baseline was developed by EEA [14]. The estimated baseline for 2017 can be compared with 2022 exposure data and future reporting years, this dataset has been used to present “estimated” numbers of people exposed to road traffic exposure, to show how numbers are still high; however, this baseline per EU Member State is not available online and only the methodology and the overall numbers are available online [12, 13].
Other problem that the datasets provide is the changes between rounds, for roads under END, the threshold for “major roads” has evolved slightly across the different strategic noise mapping rounds. In R1, although the END suggested a reference threshold of 3 million annual vehicle passages, in practice some EU Member States applied a higher threshold of 6 million vehicles per year to define major roads [2]. To harmonise the criteria across the EU, in R2 the standard threshold of 3 million vehicle passages per year was adopted by most EU Member States [14]. This threshold continued to apply in R3, with more standardised mapping methodologies [14]. In R4, under the adoption of CNOSSOS EU, the 3 million vehicle threshold remained. Still, the methodology became more precise: all roads exceeding this flow, including national, regional, and relevant local roads, are included in noise calculations, and new propagation and emission models are applied to improve comparability across EU Member States [9]. This harmonisation allows EU-wide comparisons while maintaining the original END thresholds for major roads, although the four rounds are not directly comparable due to differences in methods and changes applied over time.
2 Methodology
All END noise mapping results are presented on the EEA Datahub website [15]. The data used in the European Environment Agency (EEA) analysis of population exposure to environmental noise are primarily sourced from noise mapping reports submitted by EU Member States under the END. These reports, produced by national and regional authorities in accordance with the Directive, assess the impact of noise from major transport sources (road, air and rail) and industrial activities. The data are collected using standardised modelling approaches, typically based on harmonised calculation methods, and cover both urban agglomerations and areas along major transport infrastructure across Europe.
In this context, the EEA aggregates, validates, and harmonises the reported datasets to provide a consistent EU-wide overview of population exposure to environmental noise. This consolidated dataset forms the basis for comparative analyses between countries, trend assessments across reporting rounds, and the evaluation of environmental noise as a determinant of public health outcomes [12, 15].
The datasets used in this work were obtained directly from the EEA Datahub [15], which serves as the central repository for END reporting data. The first version of the dataset was downloaded on 1st October 2024 and subsequently post-processed in Microsoft Excel (Microsoft Office 365) to extract the relevant variables, remove redundancies, and harmonise the data structure across Member States. This post-processing step was necessary to ensure internal consistency of the dataset and to enable its use in comparative analyses. As the dataset was later updated on 5th August 2025, a revised version was downloaded in October 2025 for the purposes of this study, corresponding to Round 4 (R4) reporting. All analyses presented in this paper are based on this updated dataset, ensuring that the results reflect the most recent information available at the time of submission.
3 Results
In this paper, we restrict our analysis to the 27 EU Member States. Other countries, such as Iceland, Norway, Switzerland, and Turkey, are not EU Member States but chose to report exposure figures. The UK left the EU in 2020 and is therefore excluded from this assessment. Croatia became an EU member on 1 July 2013, so no data were presented for the first two rounds. It is noted that the threshold for noise mapping changed significantly between R1 and the following rounds, R2, R3 and R4, resulting in a large change in the required assessment area. Table 1 summarises the overall reported changes in assessment across the 27 EU Member States within agglomerations. The threshold changes results in approximately a threefold increase in area (km2) and a 50% increase in population analysed.
Changes in identified reporting requirements from the four Rounds.
R4 includes lower ranges for both Lden and Lnight. Specifically, ranges of 45–49 dB and 50–54 dB are included in the Lden analysis, and 40–44 dB, 45–49 dB, and 50–54 dB are included in the Lnight analysis. For comparison purposes, these ranges have been omitted in this assessment, as previous rounds (R1–R3) did not report them. The inclusion of these ranges in R4 aligns with the incorporation of WHO dose – response relationships to better assess the health impacts of environmental noise, such as annoyance and sleep disturbance, as reflected in Commission Directive 2020/367 [6]. Before R4 of the strategic noise mapping process, each EU Member State applied its own national method for noise assessment. Now, under R4, all EU Member States use the CNOSSOS-EU methodology.
Figure 1 shows that the number of people exposed to environmental noise levels exceeding 55 dB Lden has increased from R1 to R3, and in R4 the reported number of people exposed above 55 dB Lden decreased. The increased from R1 to R3 could be as a result of reducing the thresholds used.
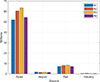 |
Figure 1. Summary of the total number of people living within agglomerations exposed to environmental noise levels 55 dB Lden. |
Because R1 applied a higher threshold for major roads (6 million vehicles/year) than subsequent rounds, fewer roads were included in the mapping, and the reported exposed population was expected to be lower. With the adoption of the standard 3 million vehicles/year threshold in R2 and R3, more roads were included, and overall exposure figures were expected to rise compared with R1. This increase is clearly reflected in the submitted data. Figure 1 compares the overall exposure for all EU Member States across the four rounds (for sources inside agglomerations).
Figure 2 shows the number of EU Member States that did not present any data for each round and source. R1 and R4 have fewer people exposed to noise levels above 55 dB Lden. These are also the two rounds in which more EU Member States did not present data. R4 shows that five EU Member States–Bulgaria, Greece, Hungary, Slovakia, and Slovenia–did not present road data at all. Other countries, such as Belgium and France, did not report all required data within agglomerations (see Tab. 2).
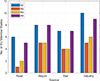 |
Figure 2. No. of EU Member States not presenting data within agglomerations for the different Rounds for people exposed to environmental noise levels exceeding 55 dB Lden. |
Percentage of agglomerations reported in road traffic noise exposure in R3 and R4.
Figure 3 summarises the total number of people exposed to noise exceeding 55 dB Lden from major roads, airports and railways outside agglomerations as no industry classification exists for areas outside agglomerations.
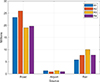 |
Figure 3. Summary of the total number of people living in majors outside agglomerations exposed to environmental noise levels exceeding 55 dB Lden. |
Outside agglomerations, the number of people exposed to environmental noise levels exceeding 55 dB Lden appear to be increased in R4. However, after reviewing the EU Member States that presented data across each round, it is again noted that R4 has the largest number of EU Member States that did not report data at all (Fig.4).
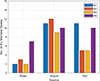 |
Figure 4. No. of Member States not presenting data within Majors without agglomerations for the different Rounds for people exposed to environmental noise levels exceeding 55 dB Lden. |
4 Road traffic exposure results and analysis
In this analysis we focus on road traffic noise, as it is the most dominant source of environmental noise across Europe, affecting an estimated 92 million people exposed to levels above the threshold defined by EEA under the END. Road traffic noise surpasses railway and aircraft noise by a wide margin, and long-term exposure has been linked to serious health impacts including sleep disturbance, cardiovascular disease, metabolic disorders and premature mortality [16].
The completeness and consistency of the exposure data submitted under the END varies substantially across EU Member States and reporting rounds. Several discrepancies have been identified in Section 2, including gaps in reported exposure indicators and differences in calculation approaches. While the most recent round (R4) required all EU Member States to apply the CNOSSOS-EU methodology for strategic noise mapping, aimed at harmonising assessment across the EU, some submissions still reflect partial data or methodological inconsistencies. As a result, assessing progress toward the END objective of reducing population exposure to environmental noise remains challenging.
The reasons for these discrepancies are not immediately clear. Some EU Member States have provided only partial or incomplete exposure data, while others differ in the precision and extent of their mapping. In the last round, R4, all Member States were required to use the CNOSSOS-EU methodology for strategic noise mapping, which harmonises calculations across the EU, but variations in data quality and coverage still affect comparability.
Full data completeness was reported in the EEA Noise in Europe report in June 2025, as outlined in Annex 1 [17]. The values presented in the report are based on data submitted by countries under the END as of 18 November 2024. Overall, data completeness at the European level was high. However, some countries had not reported their data by this deadline. France, Italy, Latvia, the Netherlands, Portugal, Romania and Spain have not provided 100% of the data for both inside and outside agglomerations. Additionally, for major roads outside agglomerations, according to the EEA report [17], seven EU Member States (Bulgaria, Cyprus, Greece, Hungary, Latvia, Slovakia, and Slovenia) did not present data in the last round, R4.
4.1 Inside agglomeration
The number of agglomerations of each EU Member State per round is presented in Table . It also displays the number of inhabitants within the agglomeration assessed, together with the number of people exposed to noise levels greater than 55 dB Lden for each round. Further, the percentage of people within the agglomeration exposed to > 55 dB Lden is also presented. As stated earlier, in the first three rounds each EU Member State used national methods to calculate the number of people exposed, while CNOSSOS-EU was used universally in R4, therefore direct comparison of results should be done with caution.
Some of the EU Member States have increased the number of agglomerations to be assessed across all rounds. Some states, such as Croatia and Lithuania, reduced one agglomeration in R4. Two countries have reduced a larger number of agglomerations assessed; Italy has reduced the number of agglomerations assessed by five comparing R4 with R3, while the most significant reduction occurred in France, where the number of agglomerations assessed was reduced by 26, reporting only 49 in R4 compared to 45 and 75 agglomerations in previous rounds, R3 and R2, respectively.
Five countries, Bulgaria, Greece, Hungary, Slovakia and Slovenia, have not presented data in the last round, R4, at the time of writing this assessment (January 2025, Revision November 2025). Greece has not provided data since 2010, and the last time they provided data in 2010 did not follow the templates as stated in the data downloaded from [12] for R3.
Of the 27 EU Member States in the last round, R4, five countries reported an overall increase in population exposure within agglomerations. Only two of these countries, Germany and Sweden, have increased the number of agglomerations assessed.
Cyprus did not submit data in R3, so a comparison between R4 and R3 cannot be made; however, we can state that in the last round, 75% of the population within the agglomeration was exposed to Lden levels above 55 dB. Germany increased the number of people exposed from 23% to 37% in the last round. Ireland, despite increasing the number of agglomerations, saw an overall decrease in the percentage from 46% to 35%. Luxembourg, like Ireland, reduced the percentage of people exposed from 94% to 80% while increasing the number of agglomerations. Sweden, like Germany, increased the percentage of exposed people from 37% to 42%. Finland increased the number of people exposed, with no change in the number of agglomerations when comparing R4 with R3. Croatia and France reported an increase in the number of people exposed, although they had fewer agglomerations in the overall assessment.
Table 2 presents the percentage of agglomerations reported in road traffic noise exposure for R3 and R4. The table indicates the number of agglomeration that needs to be reported and the actual number reported by each EU Member State, additionally the percentage of completeness is presented. Only 11 EU Member States have a 100% of agglomerations presented in the last two rounds, R3 and R4. Romania and Spain presented the lower percentage in R4 of presenting agglomerations data with 24% and 30% of the agglomerations reported respectively.
France, as presented in Table , reported that 46% of the people in R4 were exposed to Lden > 55 dB compared to 23% in R3, even though the number of assessed agglomerations was reduced by 9. This increase is due to France only reporting 29% of agglomerations in R3, as shown in Table 2. We cannot conclude that France is increasing the number of people exposed, as data is not fully available. The reduction of the number of agglomerations for R3 and R4 compared to R2 in France is due to a revision in the definition and scope of agglomerations. From 2017 onwards, instead of using the traditional INSEE “urban unit" definition, they shifted to intercommunal administrative entities (such as metropolises or urban communities above certain size and density thresholds). This allowed multiple competent authorities within the same agglomeration to be consolidated, simplifying management and reducing the number of entities required to produce strategic noise maps and action plans, without implying that the actual physical urban areas had decreased [18].
A further analysis of EU Member States with complete data in R3 and R4 is presented in Table 3. An examination of the percentages for R3 and R4 concerning the number of people exposed to different noise bands was carried out using total population data within the agglomerations provided by EU Member States. Table 3 compares the proportion of inhabitants exposed in each round per band relative to the total population of the agglomeration supplied by each EU Member State.
Percentage of people exposed to different noise bands (Lden) within agglomeration for R3 and R4.
Analysing Table 3, overall, the comparison between R4 and R3 reveals that most EU Member States have decreased the proportion of their populations exposed to higher noise levels (Lden). Several countries, including Estonia, Lithuania, Poland, and Malta, report clear reductions across nearly all noise bands, indicating significant improvements in road traffic noise exposure. Other countries, such as Austria, Croatia, Finland and Sweden, exhibit a mixed pattern, with decreases in some bands and increases in others, often shifting from the highest noise categories to lower ones rather than experiencing a consistent decline in exposure. A small number of countries, like Luxembourg and Ireland, report increases in middle noise bands compared to R3. Overall, the findings suggest a general decrease in exposure to the highest noise bands, although progress varies considerably between countries. The Lnight bands were also examined, and Figure 5 shows the difference between rounds, R4 and R3, for both parameters (Lden and Lnight). We can conclude that most countries with complete datasets demonstrate a reduction in the number of people exposed to levels above 55 dB Lden and 50 dB Lnight; however, two EU Member states, Croatia and Finland are experiencing an increase in the number of people exposed rather than a decrease. These reductions do not necessarily guarantee that EU Member States are reducing the number of people exposed, as R4 employed a different methodology than R3.
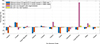 |
Figure 5. Comparison of total number exposed between R4 and R3 for Lden and Lnight. |
Figure 5 illustrates the percentage differences between R4 and R3, as shown in Table . Additionally, we present how the total population in each EU Member State shifted from R3 (2017) to R4 (2021) as well as how the number of people within agglomerations in each EU Member state changed between the two rounds. All comparisons are made as R4 minus R3. Population data by country from Eurostat [19] are only available from 2014 onwards. To ensure a consistent and complete dataset covering the period of interest, we therefore use the World Bank [20] population data, which provides annual estimates for all EU countries from earlier years. Unlike Eurostat, which reports the usually resident population as of 1 January each year, the World Bank data are mid-year estimates and include all residents present in the country, regardless of their legal status or length of stay. Consequently, these data should be considered estimates, rather than exact counts.
Croatia is the only country that shows a decrease in total population while simultaneously exhibiting an increase in the percentage of people exposed to higher levels of Lden and Lnight, 55 dB and 50 dB, respectively. Figure 5 indicates an increase in the population within agglomerations for Czech Republic (+6%), Ireland (+31%), Luxembourg (+148%) and Malta (+22%), with Luxembourg notably differing at 148%. In Round 4, Luxembourg’s population within agglomerations has more than doubled, accompanied by a total population growth of 7%. Luxembourg exhibits the most significant increase in population within agglomerations. Poland presents a nearly 0% change in people within agglomerations between both rounds.
Part of the higher reported exposure in Luxembourg may also stem from methodological factors. In [17], Table 2.1 of the report indicates that in Luxembourg, 68% and 49% of the population are exposed to higher END thresholds for Lden and Lnight, respectively, across all noise sources (airports, railways, industry, and roads). Additionally, states that comparing noise exposure across countries is challenging, noting that countries use different levels of data quality and map varying proportions of their road and rail networks, especially in urban areas. Those employing more detailed data or mapping more streets often report higher figures of people exposed to noise because their assessments are more comprehensive. For instance, urban areas in Cyprus, Belgium, and Luxembourg have mapped a large part of their street networks, which likely causes their reported impacts to appear higher compared to cities that assess only a select number of busy roads. Urban road coverage averages around 66%, but this varies significantly between and within countries. These differences in coverage and data quality complicate cross-country and cross-city comparisons, potentially overlooking many individuals who are impacted where mapping is limited.
Table 4 presents the proportion of each EU Member State’s population exposed to road environmental noise within agglomerations and across the total population for both Lden and Lnight parameters. Only the EU Member States with a 100% data presented in R4, refer to Table 3, are presented. The column “% Agglomerations" shows the share of the country’s population living in mapped agglomerations compared with the total population of each country in 2021 [20], while “%ExpAglo" indicates the percentage of people exposed to noise above the relevant thresholds within these agglomerations. The “%ExpTotal" columns estimate the proportion of the total national population exposed, taking into account both agglomeration coverage and population outside urban areas. This Table 4 enables a comparison of noise exposure levels across EU Member States and highlights the impact of mapping coverage on reported exposure figures. For example, in Austria, 32% of the population is located within an agglomeration. 57% of the population within in the agglomeration is exposed to greater levels of 55 dB Lden, resulting in a 18% of the total population in the country.
Percentage of agglomerations and population exposed to road traffic noise (Lden and Lnight).
The percentage of the population living in agglomerations varies significantly across EU Member States, ranging from 23% in Belgium to 66% in both Cyprus and Malta. Generally, countries with higher urbanisation levels tend to have a larger proportion of people exposed to environmental noise; however, this is not always the case, as differences in urban planning and noise management also influence outcomes. Exposure within agglomerations (%ExpAglo) varies significantly. Luxembourg has the highest Lden exposure, with 80% of its urban population exposed to Lden levels > 55 dB, followed by Cyrpus at 75% and Austria and the Czech Republic at 57%. In contrast, Malta and Estonia show comparatively low urban exposure, at 14% and 19%, respectively. When considering the total population (%ExpTotal) Luxembourg again records the highest at 48%, followed by Cyprus (50%), while Estonia and Poland have the lowest values, at 8% each.
Consequently, the proportion of the population exposed to Lden levels above 55 dB in R4 varies widely across EU Member States, from very high levels in Luxembourg (48%) and Cyrpus (50%) to much lower figures in Estonia (8%) and Malta (9%). It cannot be confirmed that these reductions are a direct result of the new CNOSSOS-EU method applied in R4, and confirmation will require data from R5 to assess the impact of the updated approach per country.
Across all EU Member States, exposure to noise at night (%ExpAglo and %ExpTotal for Lnight) generally remains lower than during the day. Nonetheless, some nations such as Luxembourg, Cyrpus and Croatia continue to face high nocturnal exposure, affecting more than half of their urban populations. This highlights that nighttime noise remains a significant public health issue in several EU Member States.
Some countries show high urbanisation but relatively low exposure, such as Malta, suggesting effective noise mitigation in urban areas. Others, like Croatia and Austria, have moderate urbanisation but high exposure in agglomerations, indicating concentrated noise impacts in specific cities. Luxembourg and the Netherlands represent cases of both high urbanisation and high exposure, highlighting areas where noise reduction policies could have significant benefits.
4.2 Outside agglomeration
The analysis is repeated for exposure assessments of major roads outside agglomerations. In Table , the total population per EU Member State, the number of people exposed to Lden > 55 dB, and the percentage of people exposed to greater levels of 55 dB Lden are presented.
From Table , the assessment of population exposure to noise levels above 55 dB Lden from major roads outside agglomerations across END reporting rounds (R1–R4) shows considerable variability both between countries and over time. In many cases, the number and percentage of people exposed fluctuate significantly from one round to the next. These variations mainly seem to be driven by differences in reporting practices, changes in noise modelling methods, updates in the delineation of major road networks, or gaps in the submitted datasets, rather than indicating real changes in population exposure. EU Member States such as France, Germany, and Poland display particularly notable shifts across rounds, while Denmark records a sharp decline in R4 that aligns with reduced or incomplete data submission.
Some EU Member States consistently report relatively high exposure levels, including Belgium, France and Italy in earlier reporting rounds, which may relate to the extent and characteristics of their national road networks. In contrast, EU Member States such as Lithuania, Latvia, Estonia and Malta generally display low exposure percentages across most rounds, although in several cases this coincides with limited or partial reporting. Missing data remain a challenge for certain countries, including Greece and several Eastern European Member States, limiting the ability to identify reliable long-term trends.
Overall, although the dataset offers an indication of exposure to road traffic noise outside urban areas, its interpretation is impeded by inconsistencies in reporting completeness and methodology across different rounds. The high incidence of missing or incomplete submissions in R4 notably restricts comparability with previous rounds and underscores the necessity for caution when inferring temporal or cross-national trends.
To assess changes in the number of individuals exposed to noise from major roads outside urban areas, Table 5 presents the relative change in the exposed population between reporting rounds. The percentages are calculated with respect to the number of people exposed to noise levels above 55 dB Lden and 50 dB Lnight in R3, respectively, thereby enabling a consistent comparison of reported changes in exposure between reporting rounds. Positive values indicate an increase in the number of people exposed, while negative values reflect a reduction; a value of zero indicates no change between rounds. Table 5 summarises these results and highlights the relative changes reported between R4 and R3, based on the population data provided by each EU Member State.
Table 5 shows that 16 out of the 27 EU Member States have provided complete datasets for major roads outside agglomerations, as reported in the Annex of the 2025 report [17]. These EU Member States are indicated with an asterisk (*) in Table 5, signifying that both R3 and R4 datasets were sufficiently complete to allow a consistent comparison of exposure levels.
Number of people exposed to > 55 dB Lden and > 50 dB Lnight in Rounds 3 and 4 and differences between rounds.
Among these 16 countries, eight reported a decrease in the number of people exposed to noise levels above 55 dB Lden: Austria, Belgium, the Czech Republic, Denmark, Lithuania, Luxembourg, Malta, and Poland. Denmark shows the largest reduction, with an 81% decrease between R3 and R4. This pattern suggests, in several EU Member States, a reduction in the reported exposure to road traffic noise outside agglomerations has declined. This may be attributable to differences in methodologies between reporting rounds, changes in reporting practices, or the implementation of mitigation measures.
In Table 5, blank cells indicate that an EU Member State did not provide data for R3, R4, or both reporting rounds. Consequently, percentage differences in exposure (> 55 dB Lden or > 50 dB Lnight) could not be calculated for these cases. This notation highlights countries for which comparisons between reporting rounds are not possible due to missing information.
Among the countries with complete data, Germany experienced a 147% increase in the number of people exposed to noise levels above 55 dB Lden and a 155% increase in those exposed to levels above 50 dB Lnight. In Estonia, exposure above 55 dB Lden increased by 18%, while exposure above 50 dB Lnight decreased by 43%. Lithuania showed a greater reduction in exposure above 50 dB Lnight (40%) than in exposure above 55 dB Lden (23%).
France shows an 865% increase in the number of people exposed to > 55 dB Lden and a 636% increase in those exposed to > 50 dB Lnight from major roads outside agglomerations, consistent with Annex 4 of the 2025 report [17]. Bulgaria is not presented in Annex 4 of the 2025 noise report for major roads outside agglomerations, likely due to missing or incomplete data for one or both reporting rounds. Although Croatia provided data for both R3 and R4 and is therefore included in Table 5, these data are not reported in Annex 4, possibly due to differences in reporting completeness or acceptance for this source category.
5 Discussion
The END aimed to develop a strategy to reduce European noise exposure through a harmonised noise mapping and action planning initiative. This initiative has resulted in the largest environmental noise assessment ever conceived, significantly benefiting EU Member States. However, this ambitious task required not only a commitment from every EU Member State but also accompanying the institutional apparatus of the EU and associated support. The task was undoubtedly made more difficult because some EU Member States have a long history of noise control and assessments, whereas others did not.
As presented in [21], road traffic is the main source of environmental noise in European cities and one of the main environmental risks to health and wellbeing. The study estimates that a considerable number of adults (i.e. almost 60 million and a median of 42% of the adult population) in European cities are exposed to road traffic noise levels that are harmful to health (above 55 dB Lden). In addition, it has been shown that reducing road traffic noise to WHO-recommended levels could lead to improved health outcomes in terms of reducing the number of people who are highly annoyed and the incidence of mortality [22]; however, there is still a need to enhance the availability of the noise presented by the EU Member States.
Since the EEA’s last Health Risk Assessment (HRA) in 2020 [21], an increasing amount of evidence regarding the health effects of environmental noise has emerged. This has significant implications for updating HRA studies across Europe. A 2024 European Environment Information and Observation Network (Eionet) report [23] critically analysed the current HRA methodology and suggested necessary adaptations to the previous approach. Evidence shows that transport noise has negative health effects at lower levels than previously accounted for under the END. Health risk should now be quantified starting at 45 dB Lden and 40 dB Lnight instead of the 55 dB Lden and 50 dB Lnight, as presented in the last round, R4 [23]; however, the data available at EEA datahub does not present data for the lower bands and data is only available from Lden 55 dB and Lnight 50 dB for several EU Member States.
In this context, recent advances in health-based noise assessment highlight the limitations of relying solely on energetic indicators in HRAs. Emerging equity-oriented approaches propose incorporating source-specific exposure–response relationships for annoyance and sleep disturbance, enabling noise levels to be translated into equivalent health-relevant impacts across different sources. Such methods identify the health-predominant noise source, rather than the energy-predominant source, and support more consistent prioritisation of mitigation measures within HRAs. Integrating these approaches into future European HRAs could improve alignment between strategic noise mapping, health risk quantification, and action planning, particularly when assessing combined exposures from multiple transport sources [24].
The EC has initiated infringement procedures, a formal process initiated by the European Commission to ensure that EU Member States comply with their obligations under EU law.
In the records, there are 83 cases related to noise. There are three types of cases, only 2 of the 83 cases are due to Non-conformity of transposition for directive, Bad application of directives has 22 cases, while Non-communication of transposition for directive was the most common with a 59 cases. None of the EU Member States has received any financial sanctions; however, the cases are closed, and the EU Member States shall pay the costs. Only three EU Member States, Denmark, Estonia and Lithuania, have never received any infringement related to noise, as presented in Figure 6.
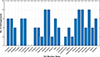 |
Figure 6. Number of Infringements per EU Member State. |
As of January 2025, November 2025 there are 11 active records regarding environmental noise. This information is from [25]. Portugal [33 INFR(2017)2066 C-687/20] and Poland [34 INFR(2017)2068 C-602/21] have two court cases for non-compliance with Directive 2002/49/EC on environmental noise management. Poland court case has a partial withdrawal from 2022. Poland was determined to have breached the Directive by inadequately developing action plans for major roads and railways and failing to provide the required summaries of these plans. Portugal was found to have neglected its duties by not providing strategic noise maps, failing to submit action plans, and not supplying necessary summaries and information related to environmental noise management.
On 18th June 2025, the EC had decided to refer Greece (INFR(2017)2150) to the Court of Justice of the European Union for failing to adopt noise action plans for all agglomerations and major roads as required under the Noise Directive (Directive 2002/49/EC). The Noise Directive identifies noise pollution levels and triggers the necessary action as a response, such as appropriate urban planning and noise protection measures. The EC stated that EU Member States were required to submit their noise maps and action plans by 2012 and 2013 respectively. The EC sent a letter of formal notice to Greece in December 2017, and an additional letter of formal notice in October 2020. Despite some progress, several grievances remained and the EC therefore sent a reasoned opinion in April 2023. The EC considers that efforts by the Greek authorities have, to date, been insufficient and is therefore referring Greece to the Court of Justice of the European Union [26]. Table presents the active cases.
These judgments underscore the critical importance of EU Member States adhering to environmental directives to ensure effective management of environmental issues such as noise pollution.
The contrasting approaches taken by the EU in regulating air quality and environmental noise highlight fundamental differences in regulatory design, enforcement mechanisms, and effectiveness. In the field of air quality, the EU establishes mandatory limit values for key pollutants such as NO2, PM10, and PM2.5. These limits are directly measured, not modelled, and must be respected in all zones and agglomerations. Compliance is assessed based on these measurements, ensuring that population exposure is actively monitored and managed.
By contrast, the END follows a largely procedural approach. It does not set EU-wide noise limit values; instead, EU Member States are required to produce strategic noise maps, prepare action plans, and inform the public at regular intervals. Noise exposure is often estimated through modelling, and compliance is linked to the completion of these procedural obligations rather than the achievement of specific noise reduction targets. As a result, unlike air quality, it is difficult to determine whether exposure to environmental noise is actually decreasing or whether policies are effective.
Taken together, these differences explain why air quality regulation has produced more measurable improvements over time, while progress on environmental noise remains difficult to track and inconsistent across countries. The European Climate Infrastructure and Environment Executive Agency (CINEA) reported in February 2024 [27] that 20% of Europeans are exposed to daytime noise levels exceeding 65 dBA during the day, surpassing the recommended maximum of 55 dBA. To address this, the EC hosted the first Low Noise networking event featuring presentations from projects aimed at mitigating noise pollution. One highlighted initiative, the LIFE C-LOW-N ASPHALT project, developed three innovative asphalt mixes designed to reduce temperatures by 2 °C and traffic noise by 3 dB at street level and 2 dB at building level [28]. Trials in Paris covered 600 meters of road, benefiting approximately 1000 residents. Surveys indicated that 63% of residents noticed a noise reduction, particularly at night. Financial analysis suggested that applying these mixes to all Paris roads with 50 km/h speed limits could save €34 million over five years, with potential savings of €400 million if extended citywide. Another project, LIFE SILENT, focuses on developing sustainable, eco-friendly solutions to reduce noise pollution from road and rail traffic in urban areas where traditional noise barriers are impractical [29] The project plans to develop and test low-height noise barriers (LHNB) and sustainable low-noise pavements in real environments to provide data supporting wider implementation. These initiatives demonstrate the EU’s commitment to reducing noise pollution and improving the quality of life for its citizens. However, to calculate the impact of noise pollution, EU Member States should provide the complete dataset for the strategic noise maps so that a full analysis can be completed.
The EEA, in October 2024 [30] presented two scenarios that could occur by 2030. Two noise pollution scenarios, one conservative and one optimistic, present different outcomes. The conservative scenario assumes adherence to current legal requirements and partial adoption of non-binding measures, such as EU noise regulations, 25% road vehicle electrification and improved aircraft procedures. Under this scenario, the number of people exposed to harmful noise levels above 55 dB Lden is projected to increase by 3%, while those highly annoyed by noise would decrease by 3%. In contrast, the optimistic scenario envisions ambitious measures, including 50% road vehicle electrification, urban speed limit reductions, rail maintenance, quieter aircraft and night curfews. This could lead to an 18% reduction in harmful noise exposure and a 23% decline in high annoyance levels compared to 2017. The more significant decline in annoyance reflects the shift of people to lower, albeit still harmful, noise levels due to implemented measures.
In December 2024 [31], the EEA presented the overall results of each noise source, where data was completed with a gap-filling exercise. They presented that 87 million people are exposed to greater levels of the END thresholds for Lden results and 55.7 million for the night-time period. These numbers increased to 110.4 million for the Lden parameter and 108.4 million for the night-time period when compared with WHO thresholds. Information was processed, and the EEA published the Noise in Europe Report in June 2025 [17]. This report concluded that transport noise remains a major environmental health issue in Europe, with more than 20% of the population exposed to harmful levels, increasing to more than 30% under stricter WHO guidelines. Road traffic is the primary source, affecting significantly more people than rail or aviation. Noise ranks among the top three environmental health risks, contributing to tens of thousands of premature deaths each year and new cases of cardiovascular and metabolic diseases, while millions experience long-term annoyance and sleep disturbance. Children are also notably affected, with impacts on reading ability, behaviour, and weight. Overall, transport noise results in the loss of 1.3 million healthy life years and economic costs of approximately 95.6 billion euros annually. Current trends suggest that the EU is unlikely to meet its 2030 zero pollution target of reducing chronic noise exposure by 30%, as noise annoyance has decreased by only about 3% since 2017.
6 Recommendations
To enhance the transparency, comparability, and robustness of reporting under the END, several improvements are recommended for Round 5 (R5). These include systematically publishing complete metadata detailing methods, modelling assumptions, and population/reference years; introducing clear completeness flags to identify data gaps and partial submissions; and providing reproducible datasets and workflows for independent verification of results. Additionally, R5 should set measurable targets for data transparency and standardisation, such as achieving high levels of metadata completeness, expanding the use of reproducible inputs, and ensuring consistent adherence to the official data model, to support ongoing improvements in future reporting rounds. Below, we present further recommendations for R5; however, presenting the datasets completed by each EU Member State should be mandatory and the EC might consider imposing financial penalties.
In addition, the END would benefit from more explicit and stringent spatial data requirements for strategic noise maps, particularly regarding geometric resolution, raster-to-vector conversion, and post-processing practices. Evidence from recent assessments shows that varying polygonisation algorithms, generalisation levels, and smoothing procedures can introduce geometric artefacts and bias population exposure estimates. To preserve the local nature of noise exposure and ensure comparability across administrative units, post-processing of high-quality noise maps should be discouraged, and EU Member States should be encouraged to publish original raster outputs or pixel-conform vector data, with polygon boundaries strictly following raster cell edges [32].
To further enhance R5 reporting and reduce population exposure to traffic noise, several supporting measures should be considered. Firstly, EU Member States should be required not only to prepare noise action plans but also to implement the measures outlined in them actively. This could involve traffic calming measures, low-noise road surfaces, and speed restrictions in areas with high population density.
Furthermore, more robust monitoring and evaluation mechanisms are necessary to ensure that planned interventions yield measurable reductions in traffic noise. Systematic follow-up would enable authorities to monitor progress, detect deficiencies, and modify strategies accordingly. Investment in noise mitigation infrastructure should also be prioritised, including noise barriers, improved road surfaces, and building insulation along major transport corridors. Such measures would provide tangible reductions in exposure for those most affected. Finally, public engagement and integration with other transport policies are essential. Involving local communities in planning and evaluating noise-reduction initiatives can improve compliance and social acceptance. Aligning traffic noise mitigation with sustainable mobility, air quality, and urban planning strategies can maximise both health and environmental benefits.
Collectively, these actions, alongside improved reporting standards and data transparency, would strengthen R5’s ability to reduce traffic noise exposure across Europe effectively.
7 Concluding remarks
The END made significant strides in addressing noise pollution through noise mapping and action planning. However, the success of this effort depends on full commitment from all EU Member States and robust institutional support at the EU level, which has been complicated by different national histories in noise control. Road traffic remains the primary source of environmental noise in European cities, with millions of adults exposed to harmful noise levels. Recent studies highlight the health risks associated with noise and suggest that reducing road traffic noise to WHO-recommended levels could improve public health outcomes. Despite this, the availability of accurate and comprehensive noise data from EU Member States remains challenging.
A recent EU audit [33] evaluated air and noise pollution in three countries (Greece, Spain and Poland), focusing on three cities (Athens, Barcelona and Krakow). The findings included that regarding noise pollution, the EU lacks noise reduction targets (as opposed to clear targets in air pollution for example), which discourages EU Member States from prioritising noise reduction. Further the EU legal framework on air quality is being revised to introduce stricter standards by 2030, whereas the END has never been revised. It is however noted that the Annexes have been revised and incorporated the WHO dose response to assess the health impacts of environmental noise. The END does not currently establish specific limits or targets for environmental noise. Therefore, future revisions could benefit from introducing clear noise limits across EU. Such limits would provide greater legal certainty and enhance accountability for policymakers and responsible authorities. While challenges exist, such as variability in local conditions, enforcement complexities, and potential economic impacts, these could be addressed by implementing minimum baseline limits alongside context-specific targets. Additionally, the EC could support EU Member States by offering stronger incentives for noise reduction measures.
Recent evidence underscores the need to update the EU’s health risk assessments. This calls for new thresholds for noise exposure-related health risks and introduces a refined method for evaluating noise at lower levels. With growing recognition of noise’s health impacts, the EU is advocating for more sustainable solutions, such as low-noise pavements and barriers. Additionally, implementing CNOSSOS-EU across all EU Member States would enable consistent noise exposure assessments, enhancing comparison and policy development accuracy.
The EAA’s 2030 scenarios illustrate how various noise mitigation measures could significantly reduce harmful noise exposure and annoyance, with the optimistic scenario foreseeing substantial improvements in public health outcomes. The EU has taken action against non-compliant countries with Directive 2002/49/EC on environmental noise. Compliance with the Directive is essential to improve noise management, including developing accurate noise maps, implementing effective noise action plans and assuring transparent reporting and public involvement in noise reduction efforts.
Although some data gaps remain from R4, the EEA has conducted extensive work to fill these gaps, using gap-filling methods to produce a more complete dataset. While these gap-filled data do not fully mirror the original country submissions, they offer a valuable reference point that allows for comparisons between countries and over time. By ensuring that metadata, completeness flags, and reproducible datasets are consistently applied in R5, it will be possible to assess trends more transparently and reliably, supporting evidence-based decision-making and highlighting areas where additional noise reduction measures are necessary. With the implementation of CNOSSOS-EU across all EU Member States, R5, scheduled for 2027, will be the first dataset comparable with R4. R5 will be a vital opportunity to evaluate whether EU Member States are effectively reducing the number of people exposed to environmental noise.
In 2016 [34] King and Murphy observed that, nearly 20 years after the EU Green Paper on Future Noise Policy, it was still impossible to base an assessment on evidence as to whether noise exposure is decreasing (or indeed increasing) across the EU. They noted that, based on data submitted to the EU for R2, there appears to be little political or institutional willingness to treat noise as a significant public health issue. Despite four rounds of noise mapping, improved data availability and quality have not yet resulted in conclusive evidence that noise levels are declining. Although the END framework has facilitated the collection of noise exposure data, its effect on implementing effective noise reduction measures remains uncertain. Political and institutional inertia, together with the difficulties in executing noise action plans, suggest that noise pollution continues to be undervalued as a public health concern.
After four reporting rounds, the EEA identifies several ongoing barriers that impede effective tracking and management of environmental noise under the END. Significant delays in submitting strategic noise mapping data, inconsistent or absent noise action plans, and the lack of a legal obligation to implement measures all undermine the accuracy of EU-level assessments. Along with the absence of binding EU-wide noise-reduction targets, these issues reduce incentives for meaningful action. The main issue is that some EU Member States do not provide strategic maps, making it impossible to determine realistically how many people are exposed to harmful noise levels.
Several EEA reports emphasise the urgency of the issue. In October 2024 [29], two scenarios projected that, under current legal requirements, the number of people exposed to harmful noise levels above 55 dB Lden could increase, while even ambitious mitigation measures would only partially reduce exposure. In December 2024 [30], the EEA estimated that 87 million Europeans are exposed above END thresholds, rising to 110 million when compared to stricter WHO guidelines, highlighting the scale of the problem. The June 2025 “Noise in Europe" report [17] confirmed that transport noise remains a major environmental health risk, contributing to premature deaths, cardiovascular and metabolic diseases, sleep disturbance, long-term annoyance, and impacts on children’s reading, behaviour, and weight. Overall, these findings indicate that people in Europe continue to face high levels of environmental noise, and it is becoming increasingly difficult to determine whether exposure is actually declining. Without complete, timely data submission by EU Member States, it remains unclear if the EU can achieve the 2030 zero-pollution target, raising fundamental questions about the effectiveness and purpose of the reporting process.
Conflicts of interest
The author declares no conflict of interest.
Data availability statement
The research data associated with this article are included within the article.
References
- European Commission: Green paper of the European Commission: future noise policy. COM 96 (1996) 540. [Google Scholar]
- European Union: Directive 2002/49/EC relating to the assessment and management of environmental noise. Official Journal of the European Communication L 189, 2002, issued in 2022. [Google Scholar]
- Zero Pollution Action Plan: [Online]. Available: https://environment.ec.europa.eu/strategy/zero-pollution-action-plan_en#documents [Accessed: Nov. 25, 2025]. [Google Scholar]
- European Commission: Commission Directive (EU) 2015/996 of 19 May 2015 establishing common noise assessment methods according to Directive 2002/49/EC of the European Parliament and of the Council. Official Journal of the European Union L 168 (2015) 1–823. [Google Scholar]
- Regulation (EU) 2019/1010: Regulation of the European Parliament and of the Council of 5 June 2019 on the alignment of reporting obligations in the field of legislation related to the environment, and amending Directives 2002/49/EC, 2004/35/EC, 2007/2/EC, 2009/147/EC and 2010/63/EU. [Google Scholar]
- Commission Directive (EU) 2020/367: Amending Annex III to Directive 2002/49/EC regarding assessment methods for harmful effects of environmental noise. Official Journal of the European Communication (2020). [Google Scholar]
- World Health Organization (WHO): Environmental Noise Guidelines for the European Region. WHO Regional Office for Europe, Copenhagen, 2018. [Google Scholar]
- E.A. King, E. Murphy, H.J. Rice: Implementation of the EU environmental noise directive: lessons from the first phase of strategic noise mapping and action planning in Ireland. Journal of Environmental Management 96, 3 (2011) 756–764. [Google Scholar]
- JRC 2012 Reference Report (CNOSSOS-EU – common noise assessment methods), S. Kephalopoulos, M. Paviotti, F. Anfosso-Lédée: Common Noise Assessment Methods in Europe (CNOSSOS-EU). European Commission Joint Research Centre (JRC) Reference Report, EUR 25379 EN, 2012. [Google Scholar]
- -J.P. Faulkner, E. Murphy: Road traffic noise modelling and population exposure estimation using CNOSSOS-EU: insights from Ireland. Applied Acoustics 192 (2022) 108692. [Google Scholar]
- J.-P. Faulkner, E. Murphy, H.J. Rice, J. Kennedy, E. Bourke: Assessing rail-based environmental noise exposure using CNOSSOS-EU. Applied Acoustics 207 (2023) 109322. [Google Scholar]
- European Environment Agency: Estimated number of people exposed to noise. European Environment Agency, May 4, 2022. [Online]. Available: https://www.eea.europa.eu/en/analysis/indicators/exposure-of-europe-population-to-noise/estimated-number-of-people-exposed [Accessed: Jan. 27, 2025]. [Google Scholar]
- N. Blanes, J. Fons, M. Hintzsche, M. José Ramos, M. Sáinz, R. Milego, E. Peris: Development of a 2017 baseline to monitor noise under the zero pollution objectives. Methodological document. (Eionet Report – ETC HE 2023/10). European Topic Centre on Human Health and the Environment, 2023. [Google Scholar]
- European Environment Agency (EEA): Environmental Noise Directive, 2010. [Online]. Available: https://environment.ec.europa.eu/topics/noise/environmental-noise-directive_en [Accessed: Nov. 3, 2025]. [Google Scholar]
- European Environment Agency: Datahub item: C952F520-8D71-42C9-B74C-B7EB002F939B. [Online]. Available: https://www.eea.europa.eu/en/datahub/datahubitem-view/c952f520-8d71-42c9-b74c-b7eb002f939b [Accessed: Oct 1, 2024 and 01 Oct 2025]. [Google Scholar]
- European Environment Agency (EEA): Sustainability of Europe’s mobility systems: Transport noise, 2024. Published 10 October 2024. [Google Scholar]
- European Environment Agency (EEA): Environmental Noise in Europe – 2025 Report. [Online]. Available: https://www.eea.europa.eu/en/analysis/publications/environmental-noise-in-europe-2025 [Accessed: Nov. 3, 2025]. [Google Scholar]
- Bruitparif: Révision de la liste des collectivités autorités compétentes pour la mise en œuvre de la directive européenne. [Online]. Available: https://www.bruitparif.fr/revision-de-la-liste-des-collectivites-autorites-competentes-pour-la-mise-en-oeuvre-de-la-directive-europeenne/ [Accessed: Nov. 3, 2025]. [Google Scholar]
- Eurostat: Data Explorer. [Online]. Available: https://ec.europa.eu/eurostat/web/main/data [Accessed: Nov. 3, 2025]. [Google Scholar]
- World Bank: Total Population (SP.POP.TOTL). [Online]. Available: https://data.worldbank.org/indicator/SP.POP.TOTL?end=2024&start=1969 [Accessed: Nov. 25, 2025]. [Google Scholar]
- EEA: Impact of road traffic noise on annoyance and preventable mortality in European cities: a health impact assessment. Available: [EEA Noise Report], [Accessed: Feb. 3, 2025]. [Google Scholar]
- S. Khomenko, M. Cirach, J. Barrera-Gómez, E. Pereira-Barboza, T. Iungman, N. Mueller, M. Foraster, C. Tonne, M. Thondoo, C. Jephcote, J. Gulliver, J. Woodcock, M. Nieuwenhuijsen: Impact of road traffic noise on annoyance and preventable mortality in European cities: a health impact assessment. Environment International 162 (2022) 107160. [Google Scholar]
- N. Engelmann, N. Blanes Guárdia, J. Fons-Esteve, D. Vienneau, E. Peris, M. Röösli: Environmental noise health risk assessment: methodology for assessing health risks using data reported under the Environmental Noise Directive (Eionet Report – ETC HE 2023/11, version 2). European Topic Centre on Human Health and the Environment, 2023. [Google Scholar]
- M. Bolognese, E. Ascari, G. Crifaci, G. Stasi, G. Licitra, L. Fredianelli: Methods for ensuring equity in noise-induced annoyance and sleep disturbance from different sources. Science of The Total Environment 1000 (2025) 180331. [Google Scholar]
- European Commission: Search – Infringement Decisions (Noise). [Online]. Available: https://ec.europa.eu/implementing-eu-law/search-infringement-decisions/?lang_code=EN&r_dossier=&noncom=0&decision_date_from=&decision_date_to=&active_only=0&DG=TAXU&submit=Search&langCode=EN&version=v1&typeOfSearch=byCase&page=1&size=10&order=desc&sortColumns=refId&dg=ENV&title=NOISE [Accessed: Nov. 3, 2025]. [Google Scholar]
- European Commission: Press Release IP/25/1507. [Online]. Available: https://ec.europa.eu/commission/presscorner/api/files/document/print/en/ip_25_1507/IP_25_1507_EN.pdf [Accessed: Nov. 3, 2025]. [Google Scholar]
- European Climate, Infrastructure and Environment Executive Agency: Sshhhh – LIFE projects provide road noise reduction solutions for a quieter Europe. CINEA News, 20-Feb-2024. [Google Scholar]
- LIFE COOL & LOW NOISE ASPHALT (LIFE16 ENV/FR/000384): European Commission, LIFE Programme. Accessed: Apr. 15, 2025. [Online]. Available: https://webgate.ec.europa.eu/life/publicWebsite/project/LIFE16-ENV-FR-000384/life-cool-low-noise-asphalt [Accessed: Feb 13, 2025]. [Google Scholar]
- LIFE SILENT – Sustainable Innovations for Long-life Environmental Noise Technologies (LIFE22 ENV/IT/101114310), European Commission, LIFE Programme. Accessed: Apr. 15, 2025. [Online]. Available: https://webgate.ec.europa.eu/life/publicWebsite/project/LIFE22-ENV-IT-LIFE-SILENT-101114310/sustainable-innovations-for-long-life-environmental-noise-technologies [Accessed: Feb 14, 2025]. [Google Scholar]
- European Environment Agency: Transport noise, in: Sustainability of Europe’s Mobility Systems, 2024. [Online]. Available: https://www.eea.europa.eu/en/analysis/publications/sustainability-of-europes-mobility-systems/transport-noise [Accessed: Feb. 13, 2025]. [Google Scholar]
- Estimated number of people exposed to environmental noise. European Environment Agency (EEA). [Online]. Available: https://www.eea.europa.eu/en/analysis/indicators/exposure-of-europe-population-to-noise [Accessed: Feb. 13, 2025]. [Google Scholar]
- J. Staab, A. Droin, M. Weigand, M. Dallavalle, K. Wolf, A. Schady, T. Lakes, M. Wurm, H. Taubenböck: Pixels, chisels and contours – technical variations in European road traffic noise exposure maps. Journal of Environmental Management 385 (2025) 125475. [Google Scholar]
- European Court of Auditors: Special Report 02/2025: Urban pollution in the EU. Luxembourg: Publications Office of the European Union, 2025. [Online]. Available: https://www.eca.europa.eu/en/publications/SR-2025-02 [Accessed: Jan. 23, 2025]. [Google Scholar]
- E.A. King, E. Murphy: Environmental noise – “Forgotten” or “Ignored” pollutant? Applied Acoustics 112 (2016) 211–215. [Google Scholar]
Appendix A
Full Tables
Number of agglomerations, inhabitants, and people exposed to Lden > 55 dB in EU Member States for Rounds 1–4 of the END for Road Noise.
Total population and number/percentage of people exposed to Lden > 55 dB for Rounds 1–4.
Infringement cases related to road traffic noise (Art. 258 TFEU).
Cite this article as: Redondo Martinez P. & King E.A. 2026. Road noise in Europe: The case for transparent and standardised data presentation. Acta Acustica, 10, 15. https://doi.org/10.1051/aacus/2026009.
All Tables
Percentage of agglomerations reported in road traffic noise exposure in R3 and R4.
Percentage of people exposed to different noise bands (Lden) within agglomeration for R3 and R4.
Percentage of agglomerations and population exposed to road traffic noise (Lden and Lnight).
Number of people exposed to > 55 dB Lden and > 50 dB Lnight in Rounds 3 and 4 and differences between rounds.
Number of agglomerations, inhabitants, and people exposed to Lden > 55 dB in EU Member States for Rounds 1–4 of the END for Road Noise.
Total population and number/percentage of people exposed to Lden > 55 dB for Rounds 1–4.
All Figures
|
Figure 1. Summary of the total number of people living within agglomerations exposed to environmental noise levels 55 dB Lden. |
| In the text | |
|
Figure 2. No. of EU Member States not presenting data within agglomerations for the different Rounds for people exposed to environmental noise levels exceeding 55 dB Lden. |
| In the text | |
|
Figure 3. Summary of the total number of people living in majors outside agglomerations exposed to environmental noise levels exceeding 55 dB Lden. |
| In the text | |
|
Figure 4. No. of Member States not presenting data within Majors without agglomerations for the different Rounds for people exposed to environmental noise levels exceeding 55 dB Lden. |
| In the text | |
|
Figure 5. Comparison of total number exposed between R4 and R3 for Lden and Lnight. |
| In the text | |
|
Figure 6. Number of Infringements per EU Member State. |
| In the text | |
Current usage metrics show cumulative count of Article Views (full-text article views including HTML views, PDF and ePub downloads, according to the available data) and Abstracts Views on Vision4Press platform.
Data correspond to usage on the plateform after 2015. The current usage metrics is available 48-96 hours after online publication and is updated daily on week days.
Initial download of the metrics may take a while.