Figure 4
Download original image
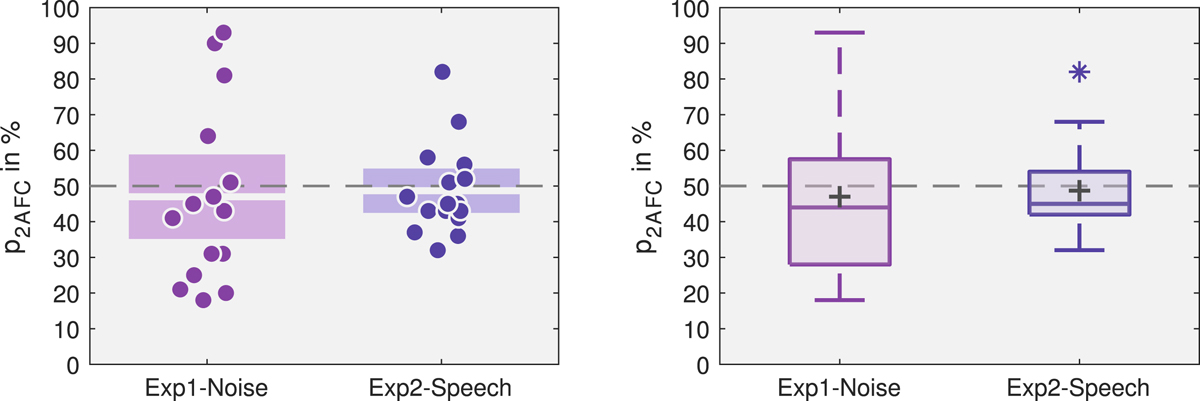
Results of the 2AFC test in Experiment 1 (Exp1-Noise) and Experiment 2 (Exp2-Speech). The left plot shows the determined individual percentages of correct answers p2AFC as points (horizontal offset for better readability). The boxes show the mean (box notch) and the 95% between-subject CI. The gray dashed line denotes 50% chance level. The right plot shows the interindividual variation in the determined p2AFC values in the form of a box plot with the median (box line), the mean (cross), and the (across participants) interquartile range (IQR); whiskers display 1.5 × IQR below the 25th or above the 75th percentile and outliers beyond that range are indicated by asterisks.
Current usage metrics show cumulative count of Article Views (full-text article views including HTML views, PDF and ePub downloads, according to the available data) and Abstracts Views on Vision4Press platform.
Data correspond to usage on the plateform after 2015. The current usage metrics is available 48-96 hours after online publication and is updated daily on week days.
Initial download of the metrics may take a while.