Figure 3
Download original image
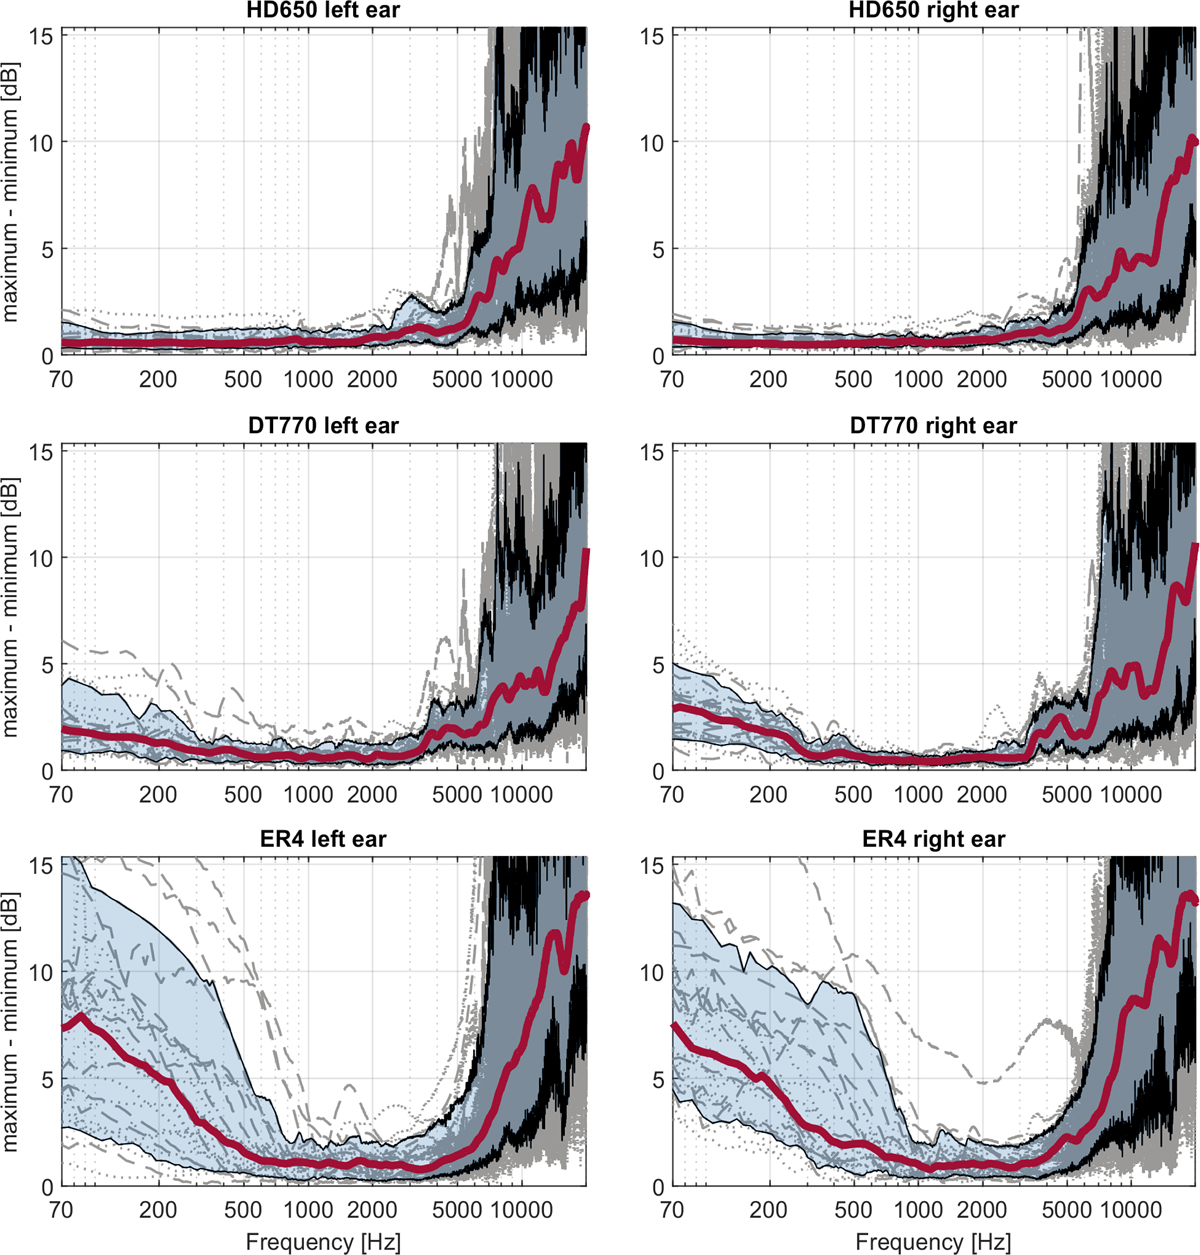
Maximum deviations for repositioning the headphones eight times for each participant in Aachen and in Oldenburg. For each frequency the maximum level [dB] minus the minimum over up to eight repetitions is taken. Left diagram relates to the left and the right diagram to the right ear. Red line shows the median (smoothed by one-twelfth moving average window). In transparent blue the range of 75% of measurement data around the median is plotted. Gray lines indicate an individual measurement. Dashed lines indicate a measurement in Aachen, dotted lines measurements in Oldenburg.
Current usage metrics show cumulative count of Article Views (full-text article views including HTML views, PDF and ePub downloads, according to the available data) and Abstracts Views on Vision4Press platform.
Data correspond to usage on the plateform after 2015. The current usage metrics is available 48-96 hours after online publication and is updated daily on week days.
Initial download of the metrics may take a while.