Open Access
Figure 10
Download original image
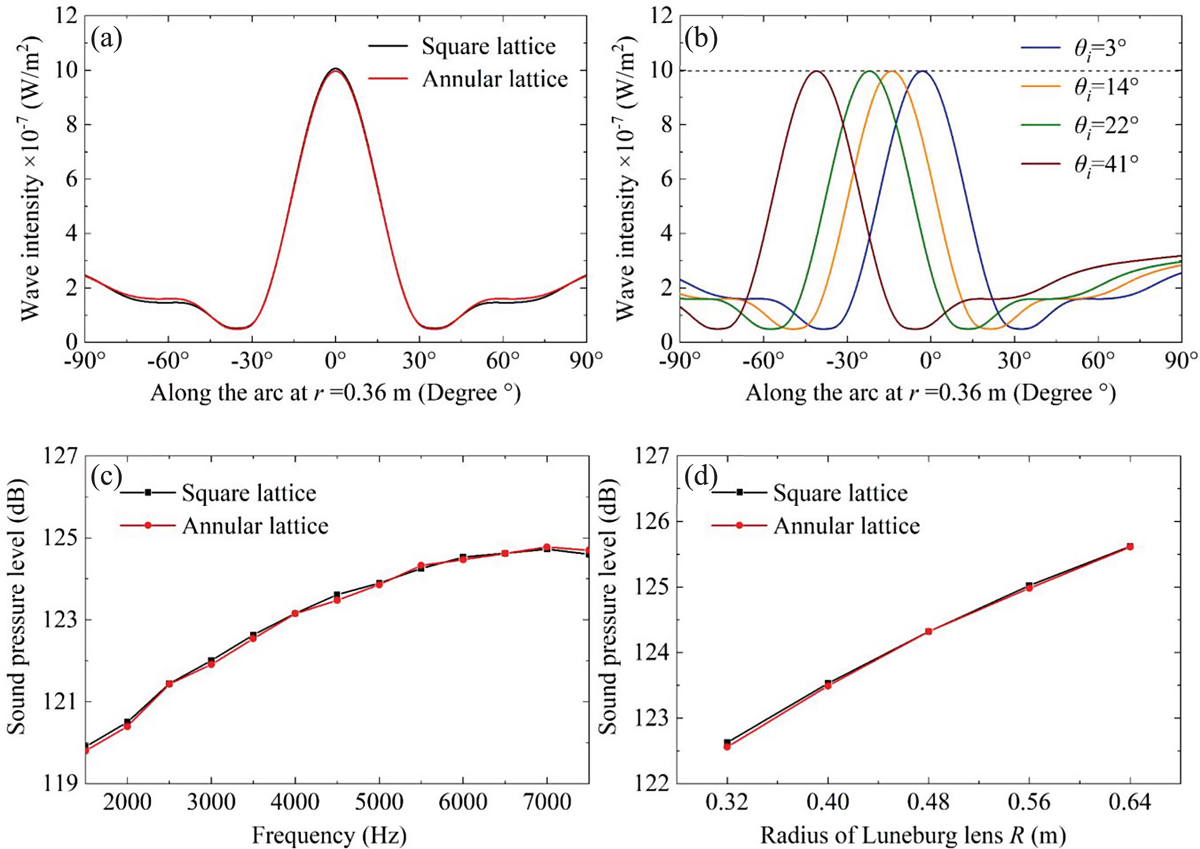
(a) Wave intensity along the arc when r = 0.36 m when θi = 0°. (b) Wave intensity profile when θi = 3°, 14°, 22°, 41°, respectively. (c) Sound pressure level as a function of frequency. (d) Sound pressure level with the radius of Luneburg lens increased.
Current usage metrics show cumulative count of Article Views (full-text article views including HTML views, PDF and ePub downloads, according to the available data) and Abstracts Views on Vision4Press platform.
Data correspond to usage on the plateform after 2015. The current usage metrics is available 48-96 hours after online publication and is updated daily on week days.
Initial download of the metrics may take a while.