Open Access
Figure 5
Download original image
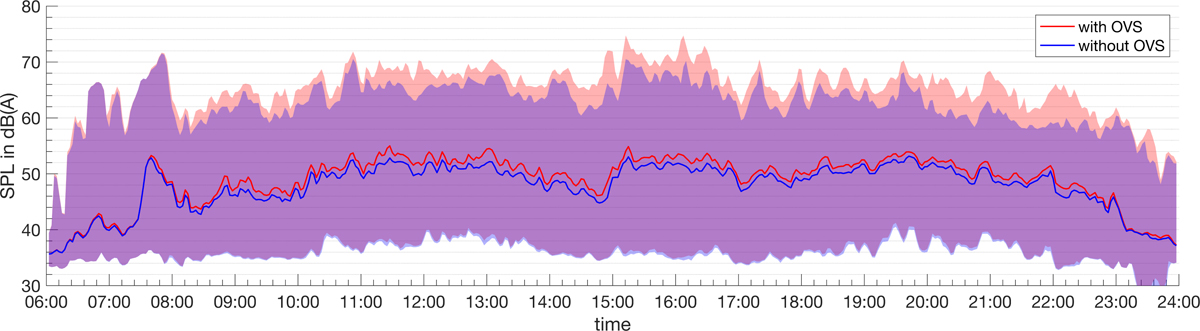
Time course of the A-weighted SPL in intervals of 5 min with 50% overlap, averaged over all participants and recording days. The solid lines give the median values and the shaded areas cover the 10th to 90th percentiles. Results including OVS are given in red and results excluding OVS are given in blue.
Current usage metrics show cumulative count of Article Views (full-text article views including HTML views, PDF and ePub downloads, according to the available data) and Abstracts Views on Vision4Press platform.
Data correspond to usage on the plateform after 2015. The current usage metrics is available 48-96 hours after online publication and is updated daily on week days.
Initial download of the metrics may take a while.