Open Access
Figure 7
Download original image
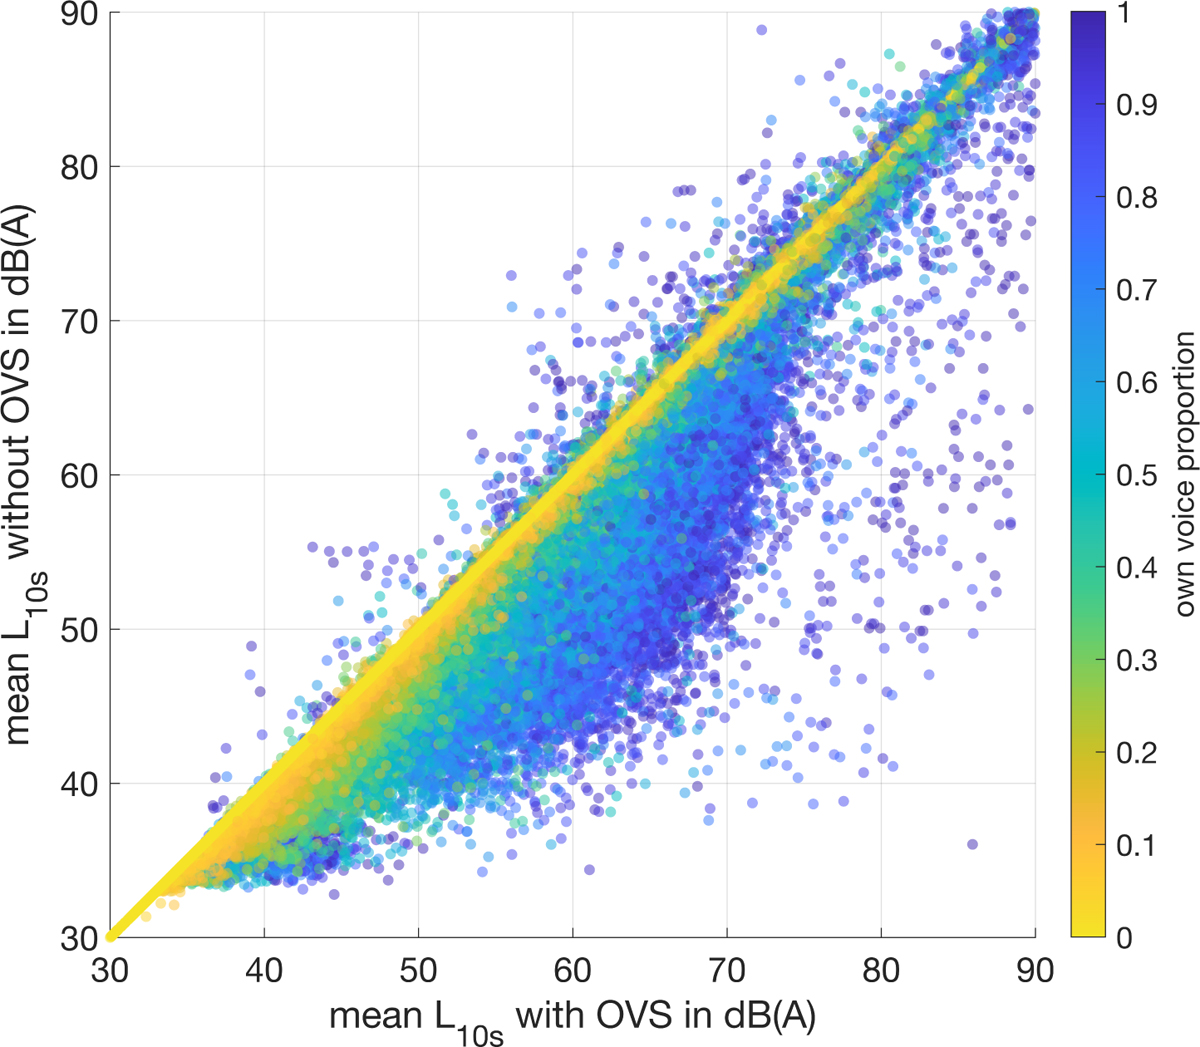
Distribution of the mean A-weighted SPL L10s calculated for 10 s-intervals with 50% overlap for all participants and recording days, on the horizontal axis including OVS and on the vertical axis excluding OVS. The color indicates the proportion of OVS in each interval.
Current usage metrics show cumulative count of Article Views (full-text article views including HTML views, PDF and ePub downloads, according to the available data) and Abstracts Views on Vision4Press platform.
Data correspond to usage on the plateform after 2015. The current usage metrics is available 48-96 hours after online publication and is updated daily on week days.
Initial download of the metrics may take a while.