Figure 7
Download original image
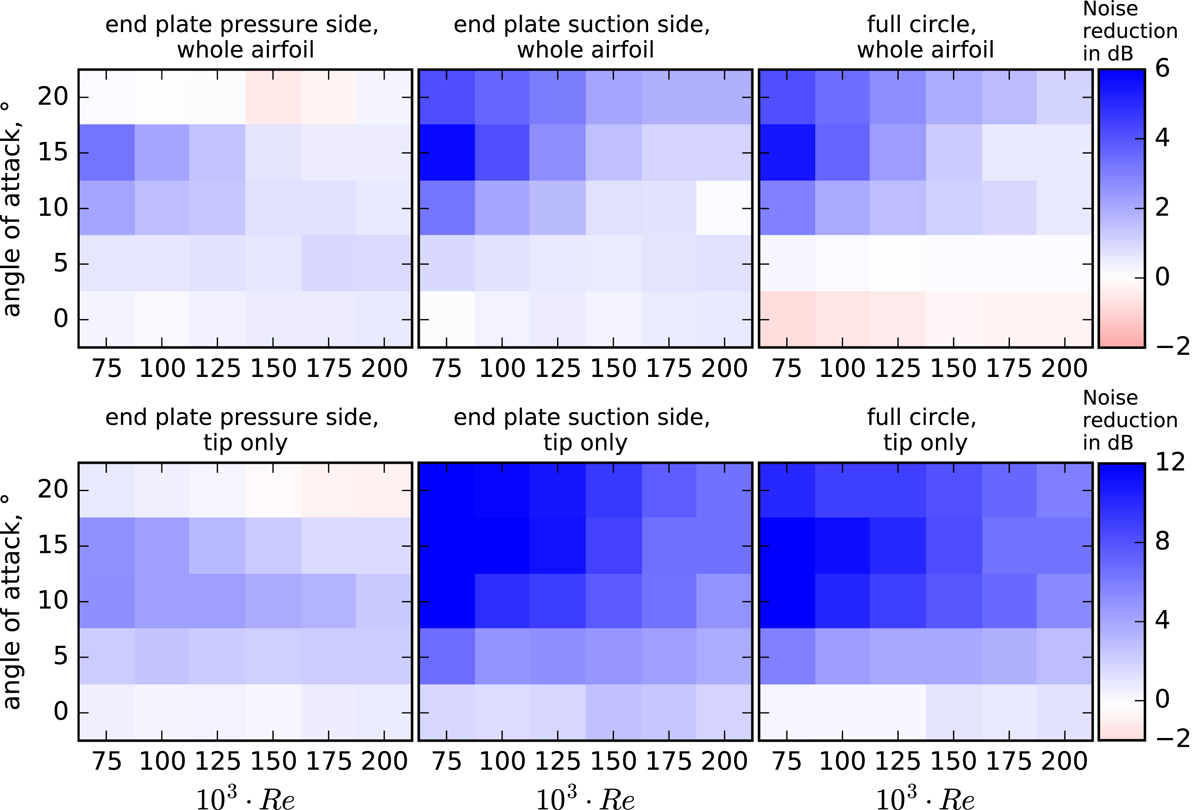
Overall sound pressure level difference of integrated spectra between base configuration and end plate applied, St < 18 and f > 1 kHz, integration area whole airfoil (top) or only tip (bottom) according to Fig. 3a, blue indicates noise reduction and red increase, note different color-bars.
Current usage metrics show cumulative count of Article Views (full-text article views including HTML views, PDF and ePub downloads, according to the available data) and Abstracts Views on Vision4Press platform.
Data correspond to usage on the plateform after 2015. The current usage metrics is available 48-96 hours after online publication and is updated daily on week days.
Initial download of the metrics may take a while.