Figure 13
Download original image
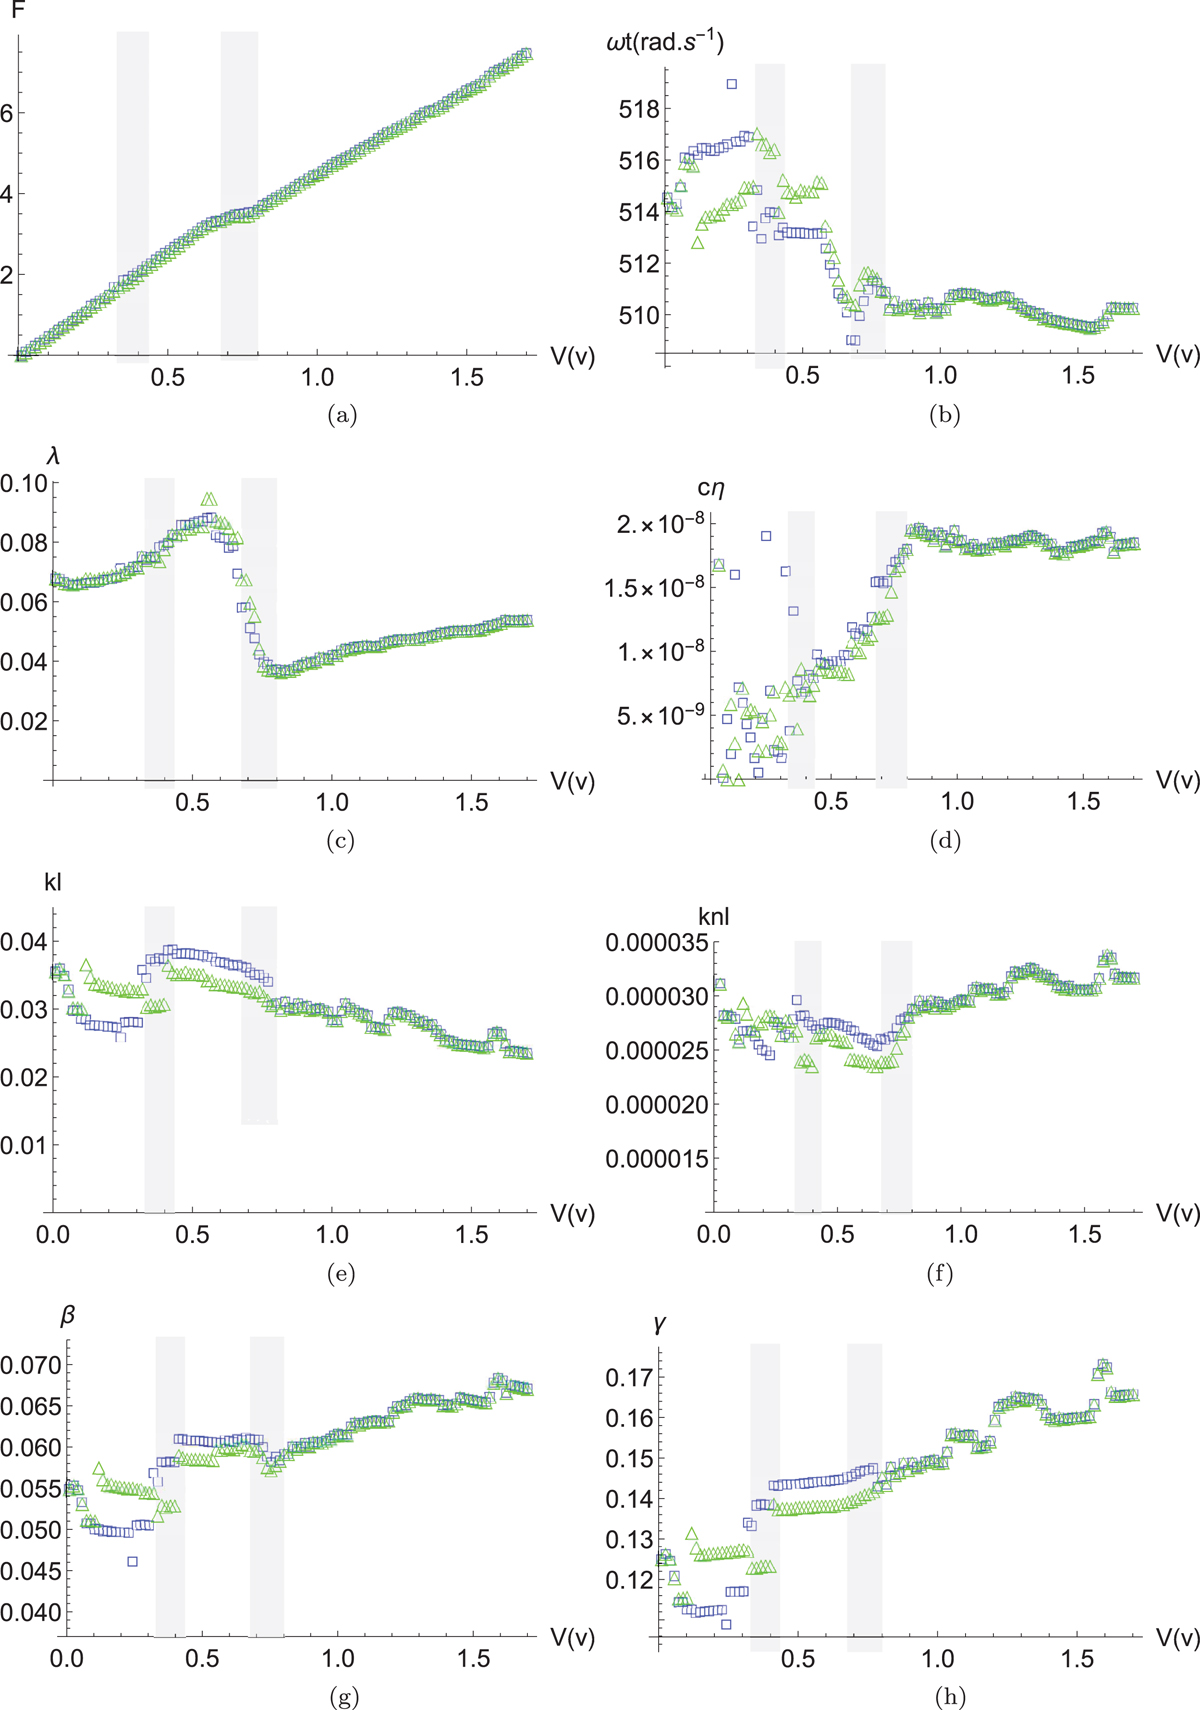
The variation of the system parameters as a function of the voltage value sent to the speaker terminal for the first configuration: hm1 = 0.23 mm, Rm1 = 5 cm, fm1 = 45 Hz. The blue squares correspond to the result given by the HBM and the green triangles by the CX-A method. The beginning and the end of the energy pumping are presented by the two grey bands. (a) F as a function of the excitation amplitude. (b) ωt as a function of the excitation amplitude. (c) λ as a function of the excitation amplitude. (d) cη as a function of the excitation amplitude. (e) kl as a function of the excitation amplitude. (f) knl as a function of the excitation amplitude. (g) β as a function of the excitation amplitude. (h) γ as a function of the excitation amplitude.
Current usage metrics show cumulative count of Article Views (full-text article views including HTML views, PDF and ePub downloads, according to the available data) and Abstracts Views on Vision4Press platform.
Data correspond to usage on the plateform after 2015. The current usage metrics is available 48-96 hours after online publication and is updated daily on week days.
Initial download of the metrics may take a while.