Figure 12
Download original image
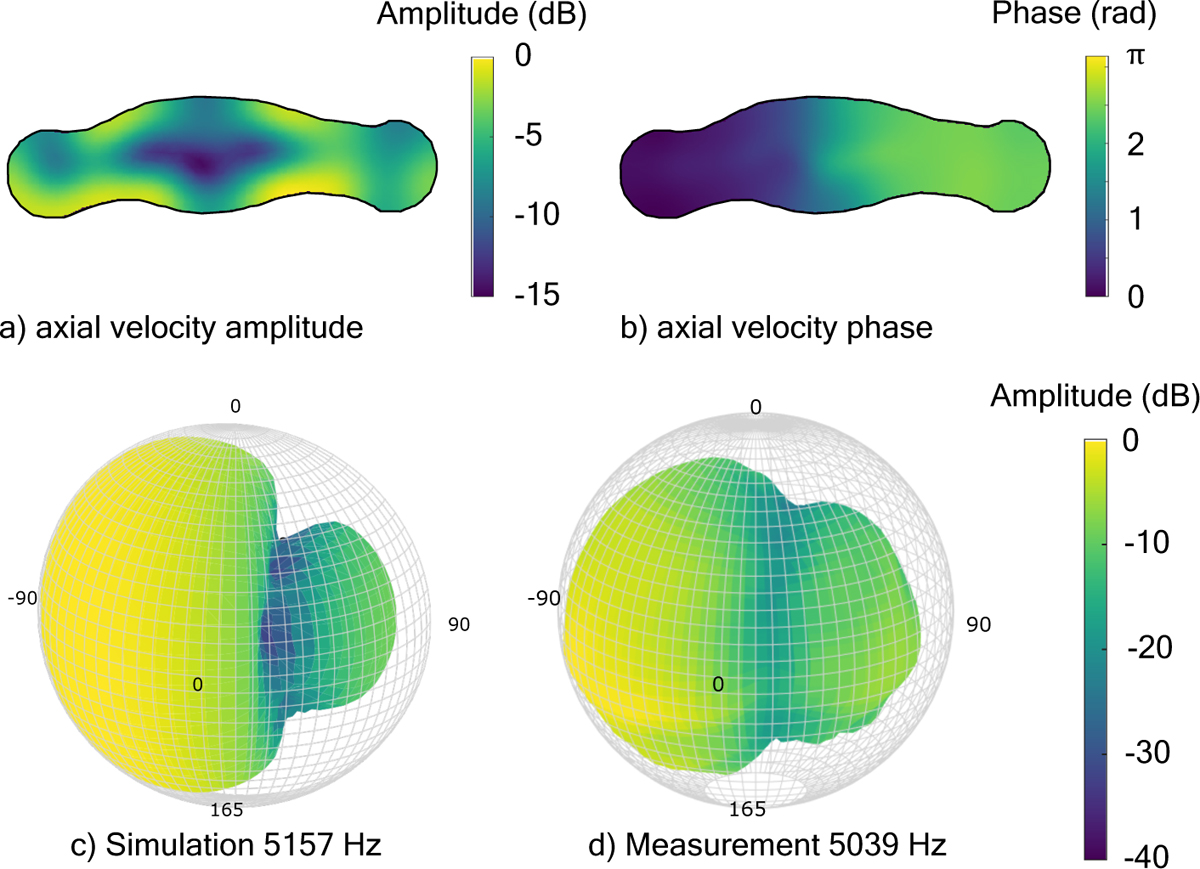
(a) Amplitude and (b) phase of the axial particle velocity simulated on the mouth exit plane of the vocal tract geometry without lips of the vowel /a/ of participant 2 at 5157 Hz and (c) the corresponding simulated directivity half-balloon. (d) Directivity balloon measured at 5039 Hz on the HATS equipped with the vocal tract replica of the vowel /a/ of participant 2 without lips and without a torso. These frequencies correspond to the vertical streaks visible around 5 kHz in Figures 9a and 9b.
Current usage metrics show cumulative count of Article Views (full-text article views including HTML views, PDF and ePub downloads, according to the available data) and Abstracts Views on Vision4Press platform.
Data correspond to usage on the plateform after 2015. The current usage metrics is available 48-96 hours after online publication and is updated daily on week days.
Initial download of the metrics may take a while.