Open Access
Figure 2
Download original image
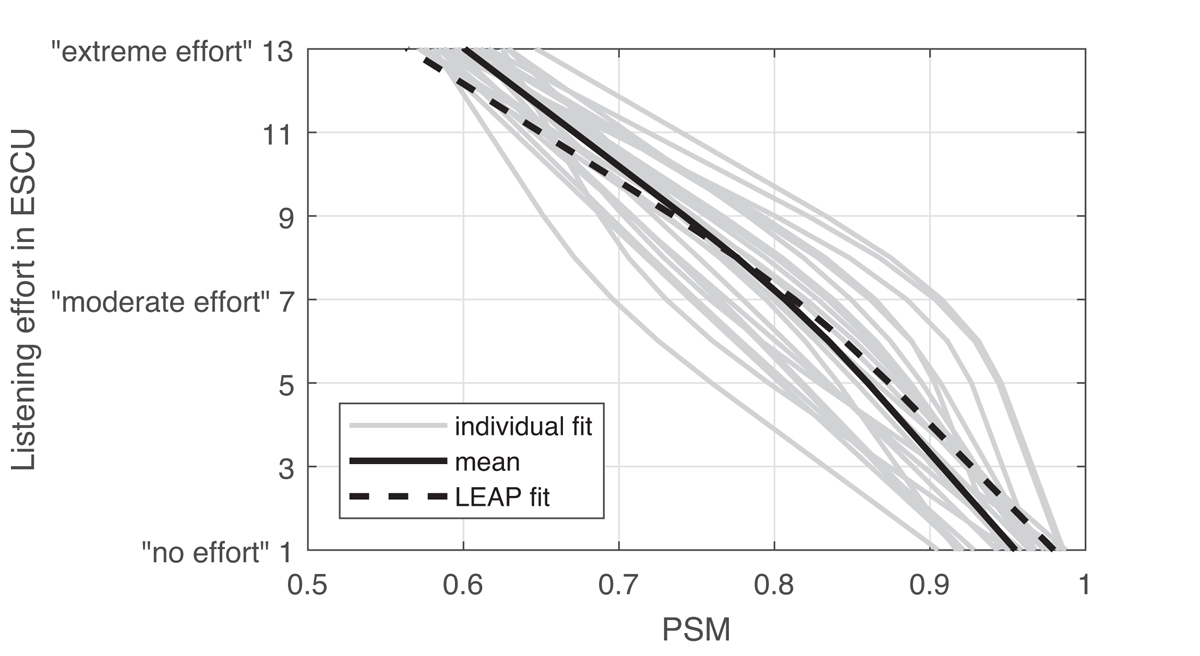
Listening effort as function of the PSM, curve fits to the individual rating data for each participant (light gray lines), the mean curve (black line), and the LEAP model prediction (dashed black line) are shown.
Current usage metrics show cumulative count of Article Views (full-text article views including HTML views, PDF and ePub downloads, according to the available data) and Abstracts Views on Vision4Press platform.
Data correspond to usage on the plateform after 2015. The current usage metrics is available 48-96 hours after online publication and is updated daily on week days.
Initial download of the metrics may take a while.