Figure 7
Download original image
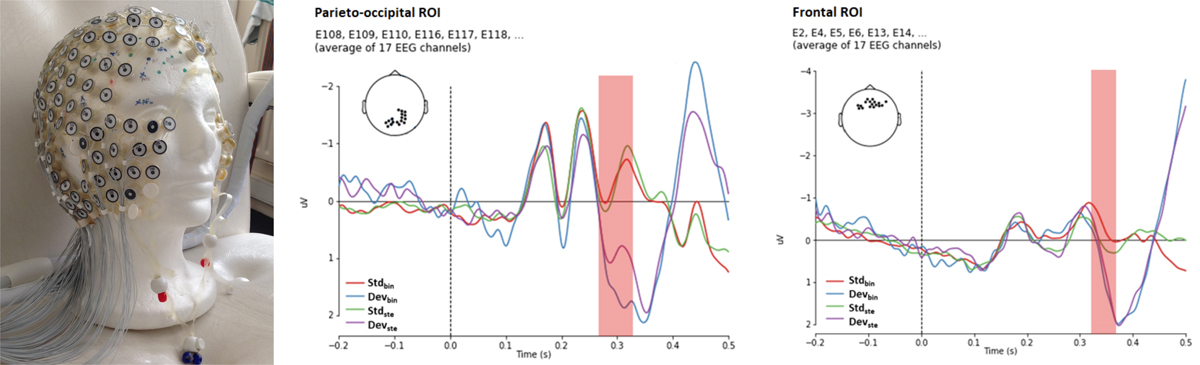
Neuroimaging for perceptual comparison of binaural and stereophonic sounds. From left to right: EGI® sensor net, average ERPs (Event Related Potential) measured in the parieto-occipital region and the frontal region. Blue and purple curves correspond to deviant stimuli in the binaural and stereophonic condition respectively, while red and green curves correspond to standard stimuli in the binaural and stereophonic condition respectively (from [151]).
Current usage metrics show cumulative count of Article Views (full-text article views including HTML views, PDF and ePub downloads, according to the available data) and Abstracts Views on Vision4Press platform.
Data correspond to usage on the plateform after 2015. The current usage metrics is available 48-96 hours after online publication and is updated daily on week days.
Initial download of the metrics may take a while.