Open Access
Figure 6
Download original image
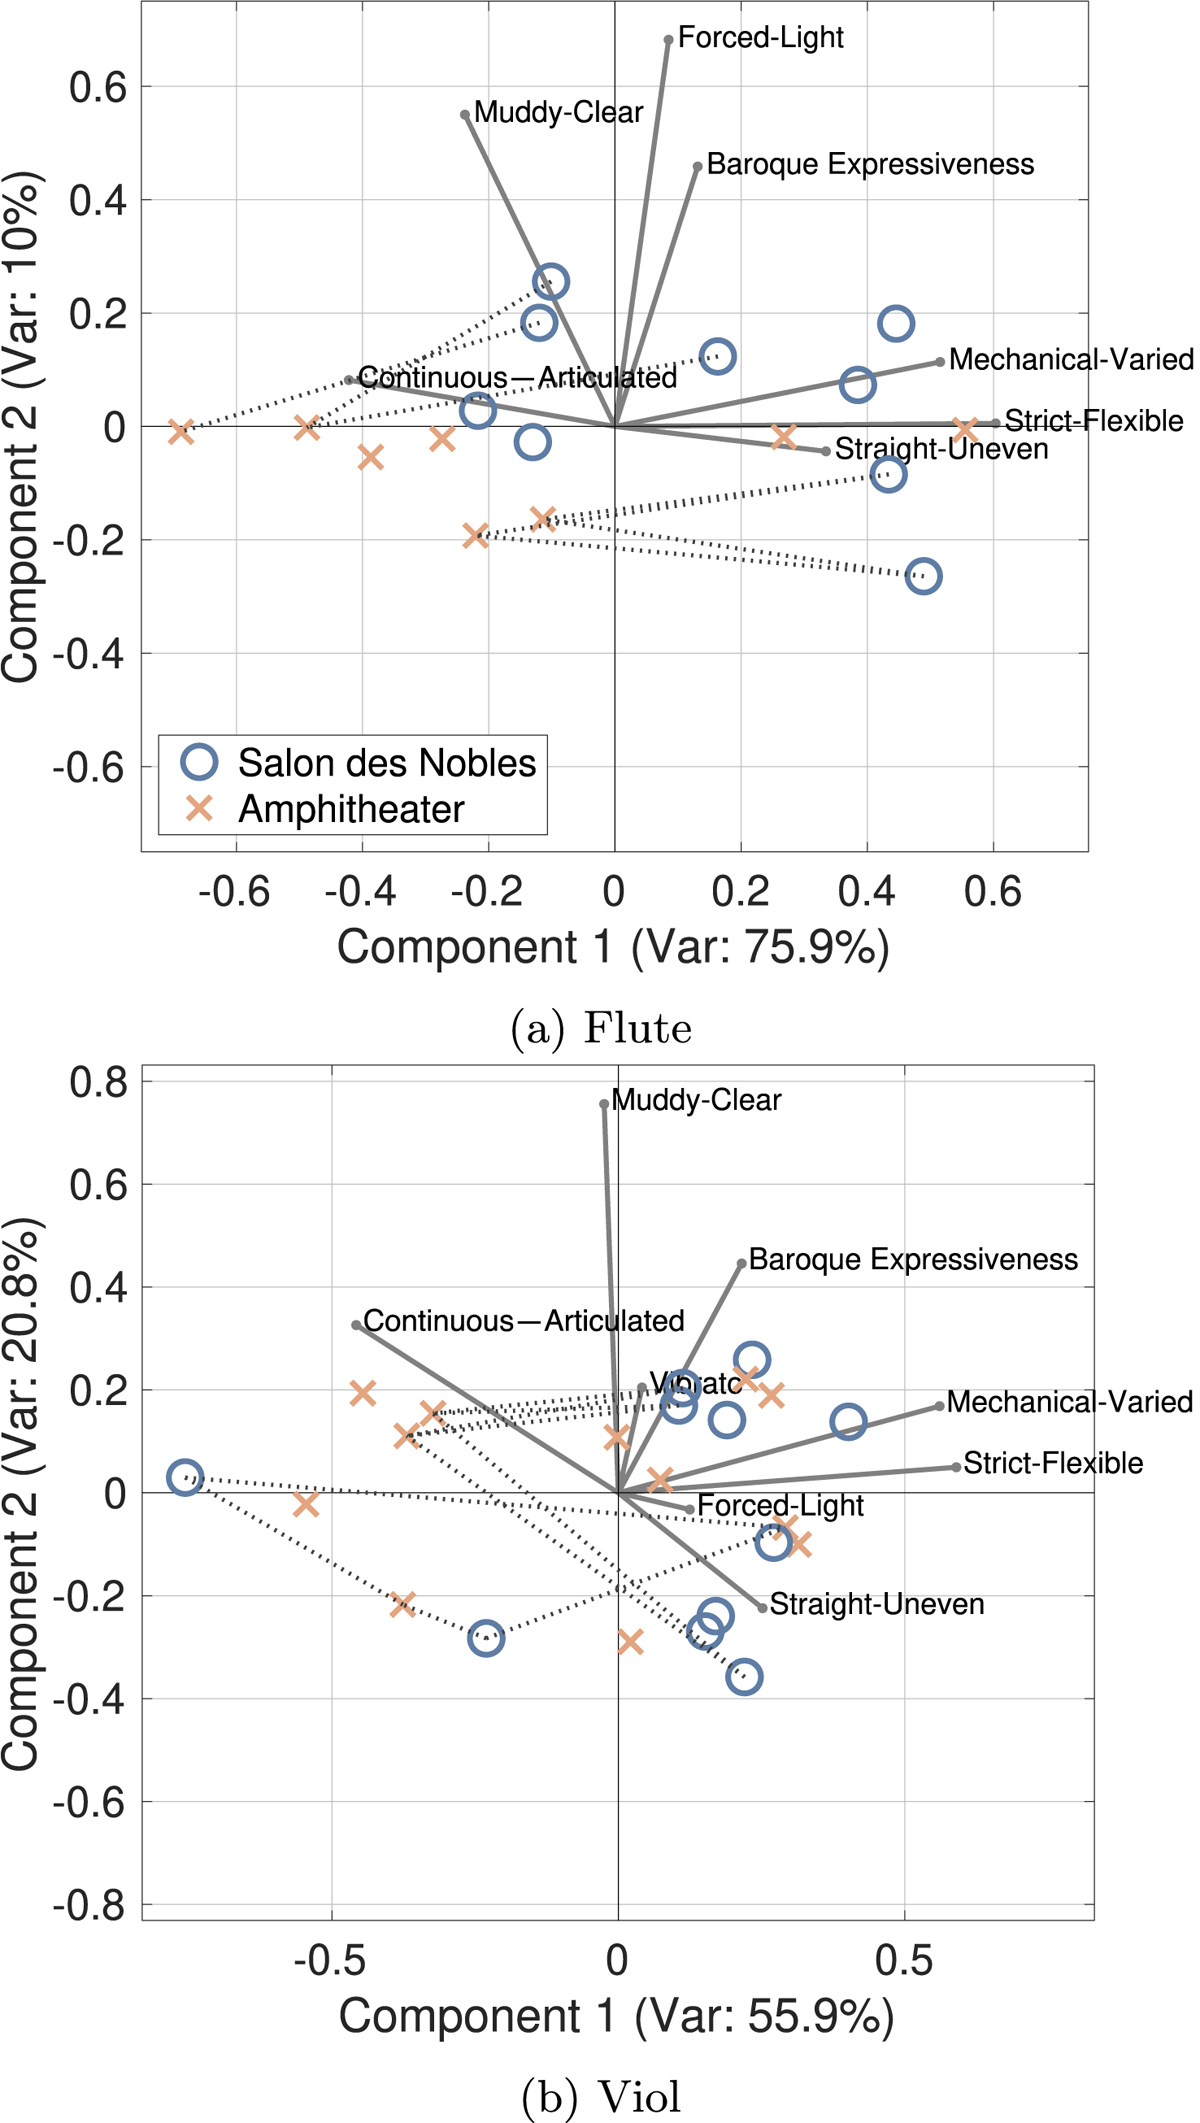
Biplots of the first two principal components resulting from a PCA of the listening test responses of the (a) flute and (b) viol examples. Dotted lines show connections between extreme performances of the same compositions in different rooms (excluding vibrato).
Current usage metrics show cumulative count of Article Views (full-text article views including HTML views, PDF and ePub downloads, according to the available data) and Abstracts Views on Vision4Press platform.
Data correspond to usage on the plateform after 2015. The current usage metrics is available 48-96 hours after online publication and is updated daily on week days.
Initial download of the metrics may take a while.