| Issue |
Acta Acust.
Volume 9, 2025
|
|
|---|---|---|
| Article Number | 34 | |
| Number of page(s) | 13 | |
| Section | Musical Acoustics | |
| DOI | https://doi.org/10.1051/aacus/2025016 | |
| Published online | 26 May 2025 | |
Scientific Article
Audibility of reduced spatial resolution in musical instrument directivity
1
Departments of Music Acoustics – IWK, University of Music and Performing Arts Vienna Anton-von-Webern-Platz 1 Vienna 1030 Austria
2
Acoustics Lab, Dpt. of Information and Communications Engineering, Aalto University P.O. Box 11110 FI-00076 Aalto Finland
* Corresponding author: This email address is being protected from spambots. You need JavaScript enabled to view it.
Received:
20
December
2024
Accepted:
14
April
2025
Abstract
The directivity of sound sources plays an important role in the generation of auralizations. Researchers have invested a considerable amount of time and effort in generating directivity databases of musical instruments with high levels of detail. However, it is still unclear how precisely these data should be captured and modeled with respect to perception. Therefore, investigating if simplified patterns with lower spatial resolutions are perceptibly different from higher-resolution patterns provides valuable insights into determining the spatial resolution required for perceptually significant measurement and modeling of directivity patterns. In this study, we present a listening test that investigates the spatial resolution of the magnitude of directivity patterns using different spherical harmonic orders of two musical instruments (a trumpet and a flute) in two listener positions and rooms. Apart from changing the resolution for the entire simulation, we also tested hybrid responses for one of the rooms, where the order was modified only for the direct sound or the early reflections.
Key words: Musical instrument directivity / Spatial directivity resolution / Listening test / Auralization
© The Author(s), Published by EDP Sciences, 2025
 This is an Open Access article distributed under the terms of the Creative Commons Attribution License (https://creativecommons.org/licenses/by/4.0), which permits unrestricted use, distribution, and reproduction in any medium, provided the original work is properly cited.
1 Introduction
Source directivity describes how much pressure a sound source radiates into different directions at each frequency. This directional behavior is inherent to the sound source and varies significantly from one source to another. Many musical instruments, for instance, exhibit spatially complex directivity patterns [1, 2].
It has been shown that the differences in directivity between instruments influence acoustic perception in rooms [3]. Nevertheless, many auralization engines only assume omnidirectional radiation or use simplified directivity models. Previous studies have shown subjective listening tests to determine the level of detail required for auralizations. Wang and Vigeant [4] investigated whether listeners could perceive differences between an omnidirectional source, octave-band-averaged instrument directivity patterns (based on the measurements by Meyer [5]), and an artificial, very directional beam source in auralizations. Due to the lack of directional data in certain frequency bands, omnidirectional patterns were used to augment the data of musical instruments at specific frequency bands. They found that only the artificial beam differed significantly from the omnidirectional source, while the octave-band-averaged patterns did not differ from it, which could be attributed to their low-frequency resolution and the applied augmentation approach. Furthermore, the spatial resolution of the directivities employed in the test is not entirely clear.
Spatial resolution of source directivity was studied by Frank and Brandner [6]. Their study used simplified frequency-independent directional beams with various spherical harmonic (SH) orders as directivity patterns in a simulated shoebox room. Their investigations revealed that, in binaural auralizations, directivities of orders higher than three for speech and five for noise were perceptually indistinguishable from a seventh-order reference. Moreover, a subsequent study demonstrated that reducing the direct sound level increased the minimum required SH order to be perceptually indistinguishable from the reference [7].
In addition to the directivity of musical instruments, voice directivity has also been studied extensively by many researchers over the years; see Leishman [8] for high-resolution measurements, [9–12] for various aspects influencing the directivity patterns, and [13, 14] for perceptual aspects such as the relevance of dynamic voice directivity. In a recent study [15] using human speaker directivity simulations, it was demonstrated that directivity information strongly influences the identification of source orientation in first-order reflections, while directivity information in higher-order reflections could be excluded to simplify the simulations. However, only Quélennec and Luizard [16] have investigated the perceptual thresholds of its spatial resolution. Using measured voice directivity data of an artificial head with a mouth simulator, they found that the averaged threshold of spatial resolution for voice directivity across several studied scenarios corresponded to an SH order of around eight.
In summary, while some studies have explored directivity in auralizations, most of the studies have focused on artificial beams [6, 7], or unidirectional patterns, including voice [13, 14, 16]; only a few investigations have included musical instrument directivity patterns in perceptual evaluations with auralizations [3, 4]. However, these investigations did not include the study of spatial resolution of the patterns.
The aim of this study is to investigate how changes in spatial resolution that result from representing the magnitude of a directivity pattern using different SH orders affect auditory perception. A triple stimulus comparison test evaluates the resolutions at which audible differences become evident with respect to a higher order reference. This study includes two instruments (a flute and a trumpet) with very different directivity patterns, allowing for a comparison of perceptual sensitivity across different musical instruments. Two different room models and listening positions were tested. Furthermore, this study examines the role of spatial resolution in both the direct sound and early reflections separately, evaluating how changes in directivity resolution in these components affect auditory perception. This has practical implications; if the required resolution was lower for early reflections than for the direct sound, computational simplification could be made in auralization algorithms. Finally, we show objective metrics characterizing the acoustical changes caused by order reduction. Relating these to the perceptual results might help to gauge the perceptual importance of differences even for other instruments than the ones tested whenever such metrics, but no perceptual data are available.
This paper is structured as follows. Section 2 describes the methodology employed for generating the simulations and auralizations used in the listening test. This section includes the details about the directivity patterns, room model, auralization software and auralization generation process. Section 3 presents the design and procedure of the listening test as well as the results. To aid the interpretation of the results, Section 4 provides an objective analysis of the room parameters affected by the variation of the spatial resolution of the directivity patterns. Finally, Section 5 summarizes the key findings from our study.
2 Method
To generate the stimuli for the subsequent listening test, directivity patterns were obtained from the Brigham Young University (BYU) directivity database [17]. Room geometry data was sourced from the Benchmark for Room Acoustical Simulation (BRAS) database [18] and the auralization software RAVEN [19] was employed. Details will be described in the following paragraphs.
2.1 Directivity patterns
The source directivity patterns used in the listening test were obtained from the BYU open-access database, which contains the directivity data of 14 musical instruments at a resolution of five degrees both in azimuth and elevation. While other databases exist, they generally offer a limited spatial resolution, such as the TU Berlin database [20], which includes an extensive selection of musical instruments but only uses 32 measurement positions, permitting 4th-order spherical harmonic expansion. Since this study focuses on the effects of higher-resolution directivity patterns, the BYU database was selected as it allows for up to 15th-order resolution. The patterns, provided as magnitudes averaged over one-third octave bands, are derived from 15th-order spherical harmonic representations and are available only in certain frequency bands within the frequency region of the instrument (160–3150 Hz for the trumpet and 250–4000 Hz for the flute). Therefore, to incorporate the directivity data in RAVEN for the remaining bands, the directivity was approximated in such a way that, in the bands below the lowest available frequency band the directivity remains constant, matching the directivity in the lowest available frequency band. Similarly, the directivity in the frequency bands above the highest available band is identical to the directivity of the highest available band. Note that SH decomposition of magnitude patterns might require a higher order than the decomposition of patterns with phase. In practice, high-resolution instrument patterns are usually available as magnitudes only, for example, derived from smoothing the spectrum of played notes [21, 22], unless they are measured using electroacoustical excitation, often requiring specialized equipment [23, 24]. Phase optimization for determining a phase that reduces the decomposition order is an ongoing research topic [25, 26].
In order to incorporate the directivity patterns in the RAVEN software, the magnitude data of the musical instruments, in third-octave bands, were encoded in the OpenDAFF format [28]. Two sources were tested: a trumpet, characterized by a very unidirectional directivity pattern, and a flute, with a more complex, less unidirectional pattern.
The trumpet, like all brass instruments, exhibits a high directivity index, which increases considerably with frequency. The flute, on the other hand, is less unidirectional, with a more complex directivity pattern that varies considerably with frequency and that presents a lower directivity index throughout the frequency range. Both directivities were normalized with respect to the frontal direction.
The 15th-order SH representation of the instruments’ directivity, obtained from the data provided in the database, served as the reference for the listening tests. According to previous studies with human voice directivity, directivities of order higher than eight are not perceived as significantly different from a reference directivity of order 35 [16], so a reference of order 15 seemed adequate for less unidirectional sources, such as a flute. In a prior study, Frank and Brandner [6] found that order reduction by simple truncation was a suitable method for auralizations. Thus, the studied lower-resolution patterns were obtained by truncation of the reference directivity pattern to lower orders. Figure 1 shows a visual representation of the directivity patterns used in the listening test, where they were truncated at various spherical harmonic orders N.
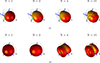 |
Figure 1. Trumpet directivity at 2000 Hz and flute directivity at 630 Hz, truncated at different spherical harmonics orders (1, 2, 4, and 15), obtained from the BYU directivity database [27]. (a) Trumpet directivity at 2000 Hz, truncated at different spherical harmonics orders. (b) Flute directivity at 630 Hz, truncated at different spherical harmonics orders. |
2.2 Room simulation
The binaural impulse responses (BRIRs) used for the listening tests were obtained through simulations performed with the RAVEN auralization software (using third-order image sources and 50 000 rays) and using the FABIAN head-related transfer function (HRTF) database [29] as the receiver. Two environments were included in the listening test: a shoebox-shaped room, modeled using SketchUp software, and a more complex scene – the small hall of the Konzerthaus Berlin, obtained from the BRAS database [18, 30]. The shoebox room had a volume of 240 m3 with dimensions of 8 m×10 m×3 m (width × length × height). The concert hall model had a volume of 3330 m3 with approximate dimensions of 18 m×12 m×10 m. The reverberation times (T30) for both rooms are presented in Table 1.
Reverberation time in seconds for different octave bands measured in the two rooms used in the listening test.
In the concert hall scene, the sound source was placed at a distance of one meter to the side of the center of the stage, with a height of one meter. The source was positioned at a height of 1.6 m above the stage (2.6 m above the floor), oriented towards the front. Two listening positions were evaluated, both situated in the audience area and at an elevation of 1.6 m above the floor. The first receiver (R1 in Fig. 2) was positioned 45 degrees to the side of the source. The second receiver (R2 in Fig. 2) was located directly in front of the source within the audience area at a distance of five meters. As the directivity pattern was normalized to the direction of the listener at R2, the direct sound at this position remains constant, even when the directivity resolution is varied; changes in resolution only affect the reflected sound, whereas at R1 both reflected sound and direct sound are expected to change. This configuration remained the same for the two instruments studied in the listening test.
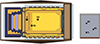 |
Figure 2. Models of the concert hall and shoebox room used in the listening test. The source position (S) is represented by a square and the receiver positions (R1, R2) by a circle. |
In the small shoebox room, the listening positions were similarly located in front and to the side of the sound source, all at a height of 1.6 m above the floor. The listening position R1 (see Fig. 2) was located 45 degrees off-axis from the source at a distance of two meters.
The auralizations used in the listening test were generated by convolving excerpts of anechoic recordings, with an approximate duration of 10 s, with the BRIRs derived from RAVEN. The anechoic signals of the trumpet and flute were recorded at a studio room in the Erich Thienhaus Institute at the University of Music in Detmold [31].
2.3 Hybrid BRIRs: Study of direct sound and early reflections
At the positions R1 in both rooms, directivity variations impact both the direct sound and reverberant field experienced by listeners. Understanding whether the direct sound or reflections are perceptually more relevant in certain situations could be beneficial from a computational perspective. This could help in the design of optimized strategies that use lower resolutions in certain components in auralizations without causing a perceptual impact.
To examine the perceptual influence of order reduction on direct sound (DS) and early reflections (ER) separately, the BRIRs were cut to isolate these components. The BRIRs were first segmented into direct sound, early reflections, and late reverberation components at fixed truncation points; The direct sound was obtained from the BRIR by detecting the maximum value and extracting the subsequent 5 ms in the BRIR. The 80 ms following the direct sound were defined as early reflections, and the remaining segment of the response was considered late reverberation. Subsequently, the hybrid BRIRs were synthesized by replacing either the DS or ER component of the reference BRIR – corresponding to the highest spatial resolution of 15th-order – with the corresponding component from another BRIR generated with a reduced spatial resolution. The late reverberation component was consistently maintained at the 15th-order spatial resolution. These hybrid BRIRs were then convolved with the anechoic recordings of the musical instruments and used in the listening test, just as the non-hybrid BRIRs. Given that patterns were normalized on-axis, the direct sound remains the same at position R2, as described above. Hence, the hybrid BRIRs with variations in the DS were not tested for this position.
3 Listening test
A listening test was conducted to evaluate whether listeners could detect differences between varying directivity resolutions of a trumpet and a flute. The auralizations were created with BRIRs obtained with sources with different directivity resolutions. Additional auralizations, generated with hybrid BRIRs, were included to investigate the perceptual significance of directivity resolution in the direct sound and early reflections.
3.1 Design and procedure
The listening test was conducted in accordance with ITU-R BS.1116-1 standard [32], also referred to as triple stimulus with hidden reference test. This method is highly sensitive and designed to detect subtle impairments. It was decided to use this method after a pilot test employing the MUSHRA method [33] revealed that the differences between conditions were too small for MUSHRA's sensitivity, requiring a more meticulous testing approach. Furthermore, this approach has proven to be useful for room acoustics studies before [34, 35].
The experiment took place in an acoustically treated listening booth at Aalto University. Participants remained seated throughout the test in front of a computer screen with a keyboard and a mouse. The binaural signals were presented to the participants through Sennheiser HD 650 headphones.
In each trial, participants were presented with three stimuli: A, B, and the reference. They were instructed to compare stimuli A and B to the known reference using a 5-point scale. The reference signal was repeated either in condition A or B, and participants were forced to grade this hidden reference with the highest score. In this way, it was possible to use the hidden reference to control the listener's reliability in the test in a post-screening analysis.
The participants were provided with a Graphical User Interface (GUI) which included three buttons for controlling the playback of the stimuli, and two continuous sliders ranging from “1-Extremely perceptible” to “5-Imperceptible”. In each trial, the test condition and the hidden reference were randomized between the A and B buttons, and participants could play these as many times as desired. Additionally, they could also adjust the playback starting point using a slider on the bottom of the interface, allowing them to focus on specific segments of the recording if needed. Participants were also given the option to switch between stimuli using keyboard shortcuts, eliminating this way the need of interacting with the interface with the mouse. In this way, participants had the possibility to close their eyes if they wished, minimizing visual distractions and helping them to focus entirely on the auditory task. The test software was developed in Matlab.
Considering the scope and the overall duration of the test, the listening test was designed to include SH resolutions of orders 0, 1, 2, 4, 7, and 15, with SH order 15 as the reference. In total, each participant completed 70 trials, corresponding to five spatial resolutions for each of the combinations of conditions specified in Table 2. Note that due to a stimulus assignment error, the 0th-order resolution was not presented in the hybrid BRIR with varying early reflections condition. Consequently, this condition was excluded from the analysis. The five resolutions were tested within blocks in a randomized order. The blocks were also presented in randomized order.
Summary of tested conditions for the listening test. Each condition was tested at five different spatial resolutions.
Participants performed a training session with three trials (containing both test instruments and positions) to ensure that they understood the task and became familiar with the interface, the testing process, stimuli, and the magnitude of differences they would experience during the experiment. The results of the training session were not included in the analysis. After the test, participants filled out a questionnaire about their musical background and their experience with listening tests. They were also asked to write down the auditory cues they had used to discriminate between sounds in their own words. The average duration of the listening test without the training session was 39 min, including a short voluntary break to avoid fatigue.
3.2 Participants
A total of 16 participants, with ages ranging from 21 to 53 years old, and a median age of 27.5 years, volunteered for the listening test. All participants except one were engineers with a strong background in acoustics or extensive musical training and prior experience in listening tests. Among the 16 participants, 11 regularly participated in listening tests, with 6 even designing their own. Although four participants had limited experience in listening tests, two of them had received at least 10 years of musical training and had occasionally participated in listening tests. The remaining two participants had less than five years of experience in musical or acoustic research. However, they spent twice as much time in the training session as the others, indicating that they familiarized themselves with the task thoroughly.
All participants reported no hearing impairments, with the exception of one who reported a slight hearing loss in one ear around 500 Hz. Despite the participant's mild hearing loss, their data were included in the analysis. This was decided because the hearing loss was minimal, unilateral, and specifically at a low frequency, which is unlikely to affect the overall results of the test, as in the listening test, differences in directivity are primarily more noticeable at higher frequencies. Moreover, the participant's performance was consistent with the observed general trends, suggesting that their hearing condition did not bias the results.
The reliability of participants was analyzed in post-screening with a one-sided t-test with the null hypothesis that the mean of the difference between test conditions and the references per participant is equal to zero, as recommended by BS.1116, excluding the apparently transparent conditions (highest three orders) to avoid underestimating the participants’ expertise. Two participants were excluded, resulting in a total of 14 participants included in the analysis.
3.3 Results
In accordance with BS.1116 recommendation, difference grades are calculated and used in the analysis. The participant's ratings, on a scale from one to five, were converted to difference grades by subtracting the reference's rating from the rating given to the test conditions. These were then averaged across subjects in order to obtain the Subjective Difference Grade (SDG) values for each test condition.
3.3.1 Full BRIR
Trumpet
An overview of the different grades obtained for the trumpet is presented in Figure 3, which show the results for the two rooms and two positions studied. A clear trend can be observed in the results, with higher ratings corresponding to higher SH orders. The lowest order tested (order 0) consistently received the lowest ratings in both scenarios and positions, mostly rated within the range of “Very perceptible” to “Perceptible” whereas the highest tested orders were rated between “Barely perceptible” and “Imperceptible”. These differences between the 0th-order resolution and the reference are expected, given that an omnidirectional pattern differs considerably from the highly directional pattern of a trumpet, with a main beam that narrows with frequency. Similarly, the 1st order resolution was rated with lower scores in all the scenes studied.
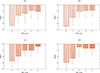 |
Figure 3. Median difference grades and 99% confidence intervals for the trumpet in both source-listener positions and scenes, based on the full BRIR (including direct sound, early reflections, and late reverberation). (a) Concert Hall, Front (R2), Trumpet. (b) Concert Hall, Side (R1), Trumpet. (c) Shoebox, Front (R2), Trumpet. (d) Shoebox, Side (R1), Trumpet. |
In the shoebox room, the overall ratings for the trumpet are a slightly higher, with resolutions N=2, N=4 and N=7 rated within one point of the highest score. No major differences are observed between the side (R1) and front (R2) listening positions. Since the direct sound remains the same in R2 due to the source directivity normalization, the perception appears to be primarily influenced by the reflected sound.
Whereas the ITU BS.1116 standard recommends conducting an analysis of variance (ANOVA), we used a Bonferroni-corrected Wilcoxon signed rank test, accounting for repeated testing across five conditions, to assess whether SDGs are significantly different from zero, as the data did not fulfill normality assumptions. Consequently, the significance level was adjusted from 0.05 to 0.01. Significant differences were observed in all rooms and receiver positions for the 0th-order resolution (p<0.001 in the concert hall for both positions and in the shoebox room for R2; p=0.008 in the shoebox room at the R1 position) and 1st-order resolutions. Additionally, significant differences were also found in the 2nd-order resolution for the concert hall room in the side (R1) receiver position (p=0.002). These results suggest that an order of 2 and lower is not sufficient.
Flute
As depicted in Figure 4, the results for the flute show a less pronounced trend than that observed for the trumpet. It can be observed that the ratings for the flute are relatively high even at lower orders, including the 0th-order resolution, falling within the range of “Perceptible” to “Barely perceptible”. The highest order conditions are rated between “Barely perceptible” to “Imperceptible”, indicating that the listeners did not perceive substantial differences between the reference and the conditions under test. Ratings remain rather consistent across all tested orders, showing a modest rating increase at higher orders, rated as “Barely perceptible”. These results suggest that the directivity pattern of the flute may not require higher-order spatial resolution to achieve perceptually acceptable results, while the trumpet seems to require higher resolutions to reach the same level of acceptability. Furthermore, slightly larger differences are observed for position R1, which may suggest that direct sound has a stronger influence on the judgments for the flute, as further explored in Section 3.3.2 when only direct sound is varied.
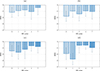 |
Figure 4. Median difference grades and 99% confidence intervals for the flute in both source-listener positions and scenes, based on the full BRIR (including direct sound, early reflections, and late reverberation). (a) Concert Hall, Front (R2), Flute. (b) Concert Hall, Side (R1), Flute. (c) Shoebox, Front (R2), Flute. (d) Shoebox, Side (R1), Flute. |
A Wilcoxon signed-rank test revealed that the SDG values for the three lowest resolutions in the concert hall differed significantly from zero in both receiver positions (p<0.001), indicating significant perceptual differences between these conditions and the reference. Additionally, the condition in the concert hall in position R1 also revealed statistically significant differences for the 4th-order resolution (p=0.004). In the shoebox, significant differences were found only for the 0th-order (p<0.001) and 1st-order (p<0.001 for R1 and p=0.003 for R2) resolutions in both receiver positions. Additionally, the 7th-order resolution exhibited unexpected significant differences (p=0.002) for receiver position R1. However, this result can be attributed to the influence of three participants who rated the test condition significantly lower than the average.
3.3.2 Hybrid BRIRs: Direct sound
As seen in Figure 5, the results of hybrid BRIRs with varying directivity in the DS show relatively high ratings across all studied orders, including the lower ones, for the stimuli in which only the direct sound was varied. As seen in previous figures, the results show a trend, with higher ratings consistently assigned to higher orders for both instruments. At the highest orders, the difference grades were very close to 0, suggesting that the detailed representation of the reflections at 15th-order resolution played a key role in the differences perceived by participants. The 0th-order source was rated as approximately “Barely perceptible” for the flute and between “Perceptible” and “Barely perceptible” for the trumpet. While for the trumpet differences were significant only for the 0th-order resolution (p<0.001), for the flute these differences were evident up to order 2 (p=0.002 for the 0th-order resolution and p=0.004 for the 1st-order resolution), indicating a stronger influence of the DS compared to the trumpet. To assess these differences, a Wilcoxon signed-rank test was also performed on the condition ratings, revealing statistically significant differences between the 2nd-order and 4th-order conditions (p=0.008). In contrast, for the trumpet, these differences were only perceived at an earlier point, namely, the 1st-order. Significant differences were observed between the 0th-order resolution and all three higher-order conditions (p<0.001).
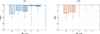 |
Figure 5. Median difference grades and 99% confidence intervals for the flute and trumpet in the concert hall scene in position R1 when only the DS is changed. (a) Concert Hall, Side (R1), Flute. (b) Concert Hall, Side (R1), Trumpet. |
Hence, resolutions for the direct sound of 2nd-order and higher seem sufficient for the trumpet if only the direct sound is varied, while the flute with a more complex pattern requires resolutions higher than 2nd-order resolution to reproduce the necessary detail in the direct sound.
3.3.3 Hybrid BRIRs: Early reflections
The results from the scenario varying the resolution of the early reflections are presented in Figure 6. Due to an error in loading the 0th-order resolution data during the test, this condition has been excluded from the subsequent analysis. Compared to the scenario examining variations only in the DS resolution, the results varying the ER do not show any clear pattern. A substantial increase in ratings is observed for all orders, which fall within the upper quarter of the grading scale, ranging between “Barely perceptible” and “Imperceptible” and thus consistently resulting in SDG values close to zero. The results do not show any statistically significant differences from the reference in any of the studied conditions. This indicates that, in the scenarios studied, reducing the spatial resolution of the ER does not result in significant perceptual differences. Therefore, simplified renderings of ER may be sufficient, provided the DS is modeled with a higher spatial resolution (see Sect. 3.3.2). However, it is essential to note that the late reverberation in the hybrid BRIRs was preserved at the highest spatial resolution (15th order), highlighting its crucial role in the perception of the sound source.
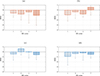 |
Figure 6. Median difference grades and 99% confidence intervals for the flute and trumpet in the concert hall scene in both source-listener position when only the ER is changed. (a) Concert Hall, Front (R2), Trumpet. (b) Concert Hall, Side (R1), Trumpet. (c) Concert Hall, Front (R2), Flute. (d) Concert Hall, Side (R1), Flute. |
Interestingly, the 7th-order condition for the trumpet, in the concert hall at the front source-listener position, received unexpectedly low average ratings, though still classified as “Barely perceptible”. Although this average value seems low, there is considerable variance in the data, and a closer examination of the individual results reveals the presence of an outlier that significantly lowered the overall rating. A Wilcoxon signed-rank test further indicates that the difference between the 7th-order condition and the reference is not statistically significant (p=0.078).
3.3.4 Qualitative analysis
Variations in the spatial resolution of the directivity caused differences in the perceived sound color and room acoustic cues. These effects were reflected in the responses provided by the listeners in the post-experiment questionnaire, where they were asked to identify the auditory cues they had used to complete the task. Participants reported changes in reverberation, spatial attributes and color as acoustic cues for their judgement. While most participants mentioned reverberation, others gave related answers, such as changes in the reverberation tail especially in high frequencies, music with more reverb, or the richness of the room. In addition to reverberation, spatial attributes were mentioned by participants, particularly in terms of spatial extent of the sources, source width, and spaciousness. Lastly, changes in coloration were also reported in their responses, which span from spectral coloration, metallic tones especially in high frequencies, to variations in timbre.
4 Objective analysis
This section examines the influence of sound source directivity on room acoustic parameters and evaluates how these variations may affect auditory perception. Previous studies have shown that variations in source directivity can lead to perceivable changes in reverberance and clarity, as demonstrated by listening experiments by Otondo and Rindel [3] and Wang and Vigeant [4]. More recent work by Frank and Brandner [6, 7] further emphasized that an essential aspect influencing the required spatial resolution of directivity in auralizations with a unidirectional source is the amount of direct sound received by the listener. In light of these previous investigations, the analysis focuses on the impact of directivity patterns on room acoustic parameters, such as Direct-To-Reverberant energy Ratio (DRR) and the Interaural Cross-Correlation Coefficient (IACC), both of which are known to influence the perception of spatial attributes, such as source width [36, 37], distance [38–40], and clarity. The room acoustic parameters were calculated at each receiver position and in both rooms using impulse responses generated with the varying source directivities.
The DRR is the energy ratio between the direct sound and the reverberant sound measured at a given listening position. A high DRR indicates a predominance of direct sound over reverberation, while a low DRR reflects a weaker direct sound and a dominance of reverberant sound.
In the listening test, participants indicated that reverberation was a primary cue used in their assessments (see Sect. 3.3.4). Therefore, the DRR values may provide insight into how varying the directivity resolutions might influence the perceptual results. For the trumpet, as the directivity resolution increases, the beam pattern of the trumpet narrows; see Figure 1a. Consequently, if the listener is positioned directly in front of the instrument, where the directivity of the trumpet has its maximum, they will receive more direct sound and less reverberant energy in both rooms studied, resulting in an increased DRR as seen in Figure 7a. It can be observed that the DRR values increase considerably in the concert hall and mildly in the shoebox room from SH order zero to order two, after which they stabilize at a similar level for the higher orders. This suggests that by order two, the directivity pattern begins to approach the 15th-order reference sufficiently that further increases in spatial resolution have a negligible effect on the DRR. The just-noticeable difference (JND) for DRR has been shown to vary depending on the absolute value of DRR, with the highest sensitivity observed when the DRR is between 0 dB and 10 dB [41]. There, the JND was observed to be close to 2 dB. In our listening test, the trumpet's DRR of the reference falls within this range. Accordingly, changes of around 2 dB may have been perceived, as reflected in the results, with SH orders 0 to 1 being most distinct from the reference. For the flute, with DRR values of −4 dB and −6 dB at the highest directivity resolution, higher JNDs are expected. As seen in Figure 7a, the largest differences between higher orders occur in the lower orders. However, these differences do not exceed 2 dB, which might be part of the explanation for the high SDG values that were already observed at lower SH orders in the case of the flute. The JND for the IACC, on the other hand, is not well established, making it difficult to determine the JND with certainty. According to Klockgether and Van De Par [42], JNDs for IACC changes are generally large, and listeners are less sensitive to IACC variations when the initial correlation is low, as at listener position R1.
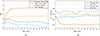 |
Figure 7. Direct-to-reverberant energy ratio (DRR) for the trumpet and flute in both tested rooms in receiver position R2 and 1-IACCE scores for the trumpet and flute in both positions in the concert hall. (a) DRR. (b) 1-IACCE. |
In the case of the flute, the trend found for the trumpet is reversed and much less pronounced, with slightly lower DRR values observed at higher orders. This may be attributed to its characteristic directivity pattern (see Fig. 1b), which exhibits lateral lobes that can potentially excite the room's lateral walls as the pattern resolution increases, resulting in increased reflection energy and, therefore, lower DRR values. The less pronounced pattern observed in the DRR values for the flute is consistent with the results of the listening test, which show a similarly subtle effect. The DRR differences due to resolution changes, however, are minimal, with differences of less than 1 dB. Furthermore, the shoebox hall comprises a lower DRR in general.
In the questionnaire, listeners also indicated changes in spatial attributes, such as source width. To investigate this further, we examine the Interaural Cross-Correlation of the first 80 ms of the response (IACCE). The early IACC is often used as an objective metric for the assessment of the apparent source width (ASW) [37], a perceptual attribute that describes the perceived width of the sound source [43]. It is defined as the maximum absolute value of the ratio between the cross-correlation function of the left and right ear impulse responses and their respective total energies, within a range of 1 ms from the zero-lag sample to either side. A lower IACCE value is generally associated with a larger perceived source width. Thus, 1-IACCE positively correlates with the perceived source width and has therefore been used in the objective analysis.
The IACCE values of the BRIRs used to generate the auralizations for the listening test were calculated to investigate how directivity variations might affect the perceived source width. The 1-IACCE values for both the flute and the trumpet, measured in the concert hall at the two studied positions, are presented in Figure 7b. As with the DRR values, a distinct knee point is observed for the trumpet, with stable, low 1-IACCE values starting from order 2, both in the frontal and lateral positions. The values for the flute show a less evident trend, remaining relatively stable over the different resolution cases studied, with only showing a slight increase at higher orders in the frontal listening position.
Finally, listeners reported perceptible changes in coloration, thus motivating an examination of the spectral characteristics. Figure 8 illustrates the spectra of different SH orders in the shoebox room for both studied instruments at position R1. For the trumpet, as seen in Figure 8a, a clear pattern is observed in the high-frequency range, where energy levels decrease as the SH order increases. For the lowest SH order tested, variations of about 5 dB are observed at frequencies above approximately 3 kHz. This decrease in high-frequency energy at higher orders is expected due to the trumpet's directivity pattern, which becomes more focused towards the front at higher frequencies. As a result, the side-positioned listener (R1) receives less high-frequency energy as the SH order increases, consistent with the trumpet's expected behavior at different resolutions (see Fig. 1a). Conversely, the spectral variations observed in the case of the flute do not exhibit a clear pattern and are instead distributed across the entire frequency range, with differences reaching up to 4 dB. This behavior can be attributed to the flute's directivity pattern, radiating more towards the sides at higher frequencies, which is emphasized as the directivity order increases, causing more high-frequency energy to be observed at R1.
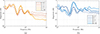 |
Figure 8. Room Transfer Functions for the trumpet and flute at various SH orders N in the shoebox room at position R1, smoothed in third-octave bands. (a) Shoebox, Side (R1), Trumpet. (b) Shoebox, Side (R1), Flute. |
5 Conclusion
This paper investigated the perceptual effects of varying the spatial resolution (expressed in terms of spherical harmonic order) of directivity patterns of a flute and a trumpet at two source-listener positions. The investigation was motivated by the need to understand how accurately directivity patterns of musical instruments should be captured and modeled with respect to human perception in auralizations. To achieve this goal, a listening test was conducted, in which participants were asked to rate the perceived similarity between five test conditions of different spatial resolution and a reference consisting of a 15th-order resolution pattern.
The results of the listening test showed that differences in directivity resolution were audible in various of the cases studied. The listening test showed expected results for the trumpet, where the similarity to the reference gradually increased with the SH order, suggesting that the trumpet's directivity is more sensitive to changes in spatial resolution. Nevertheless, listeners often reported these differences as barely perceptible at the 2nd-order resolution and higher. It should be noted that the listening test was conducted without head tracking. The absence of head tracking can affect spatial perception, particularly in terms of localization [44], externalization [45], and the reduction of front/back confusion [46]. However, we do not expect head tracking to influence the perceived differences related to directivity resolution, such as coloration and perceived reverberation, as discussed in Section 3.3.4.
Future studies could however further investigate the potential impact of head tracking on directivity perception.
In the case of the flute, the differences between the orders tested were less pronounced yet statistically significant up to the 2nd order. In general, the flute test conditions received higher similarity scores. These results suggest that its more complex, less unidirectional directivity pattern does not need as high spatial resolution as the trumpet to achieve perceptually acceptable results. It may be the case that lower-order representations are sufficient for practical purposes, even if they do not completely eliminate the detectable differences. Consequently, further increasing the spatial resolution may not yield significant perceptual benefits. Future research may investigate not only the detectability of these spatial variations but also their impact on the realism of the resulting auralization.
Furthermore, this study investigated the roles of direct sound and early reflections by isolating these components through the use of hybrid BRIRs. The study of hybrid BRIRs was particularly useful, as it allowed for a clearer understanding of how DS influenced perceptual judgments. In the case of the side position (R1), larger differences were observed for the flute compared to the trumpet when the full BRIR was modified, suggesting a stronger impact of changes in the directivity resolution used for the DS in the case of the flute. This effect was further confirmed when only the DS was varied in the hybrid BRIR, showing larger differences for the flute than for the trumpet. The results of the listening test with hybrid BRIRs varying the resolution of early reflections revealed no statistically significant differences. These findings suggest that, in the two scenarios examined, the resolution for early reflections could be simplified, provided the direct sound is maintained with a higher resolution. Further research is needed to fully understand the role of directivity resolution in the late reverberation.
Acknowledgments
The authors would like to thank Eckard Mommertz and Otavio Gomes for their advice in the early stages of this research and Lukas Aspöck for detailed advice regarding RAVEN.
Conflicts of interest
The authors declare that they have no conflict of interest.
Data availability statement
Data are available on request from the authors.
References
- J. Pätynen, T. Lokki: Directivities of symphony orchestra instruments. Acta Acustica United with Acustica 96 (2010) 138–167 [CrossRef] [Google Scholar]
- A. Corcuera, V. Chatziioannou, J. Ahrens: Perceptual significance of tone-dependent directivity patterns of musical instruments. Journal of the Audio Engineering Society 71, 5 (2023) 293–302 [CrossRef] [Google Scholar]
- F. Otondo, J.H. Rindel: The influence of the directivity of musical instruments in a room. Acta Acustica United with Acustica 90, 6 (2004) 1178–1184 [Google Scholar]
- L.M. Wang and M.C. Vigeant: Evaluations of output from room acoustic computer modeling and auralization due to different sound source directionalities. Applied Acoustics 69, 12 (2008) 1281–1293 [CrossRef] [Google Scholar]
- J. Meyer: Acoustics and the Performance of Music: Manual for Acousticians, Audio Engineers, Musicians, Architects and Musical Instrument Makers. Springer Science & Business Media, 2009 [Google Scholar]
- M. Frank, M. Brandner: Perceptual evaluation of spatial resolution in directivity patterns, in: Proceedings of the 45th German Annual Conference on Acoustics, DAGA (2019) [Google Scholar]
- M. Frank, M. Brandner: Perceptual evaluation of spatial resolution in directivity patterns 2: coincident source/listener positions, in: Audio for Virtual, Augmented and Mixed Realities: Proceedings of ICSA 2019; 5th International Conference on Spatial Audio; September 26th to 28th, 2019, Ilmenau, Germany, 2019, pp. 131–135 [Google Scholar]
- T.W. Leishman, S.D. Bellows, C.M. Pincock, J.K. Whiting: High-resolution spherical directivity of live speech from a multiple-capture transfer function method. The Journal of the Acoustical Society of America 149, 3 (2021) 1507–1523 [CrossRef] [PubMed] [Google Scholar]
- M. Brandner, R. Blandin, M. Frank, A. Sontacchi: A pilot study on the influence of mouth configuration and torso on singing voice directivity. The Journal of the Acoustical Society of America 148, 3 (2020) 1169–1180 [CrossRef] [PubMed] [Google Scholar]
- C. Pörschmann, J.M. Arend: Investigating phoneme-dependencies of spherical voice directivity patterns II: various groups of phonemes. The Journal of the Acoustical Society of America 153, 1 (2023) 179–190 [CrossRef] [PubMed] [Google Scholar]
- C. Pörschmann, T. Lübeck, J.M. Arend: Impact of face masks on voice radiation. The Journal of the Acoustical Society of America 148, 6 (2020) 3663–3670 [CrossRef] [PubMed] [Google Scholar]
- C. Pörschmann, J.M. Arend: Analyzing the directivity patterns of human speakers, in: Proceedings of the 46th DAGA, 2020, pp. 16–19 [Google Scholar]
- J. Ehret, J. Stienen, C. Brozdowski, A. Bönsch, I. Mittelberg, M. Vorländer, T.W. Kuhlen:Evaluating the influence of phoneme-dependent dynamic speaker directivity of embodied conversational agents’ speech, in: Proceedings of the 20th ACM International Conference on Intelligent Virtual Agents, 2020, pp. 1–8 [Google Scholar]
- B.N.J. Postma, H. Demontis, B.F.G. Katz: Subjective evaluation of dynamic voice directivity for auralizations. Acta Acustica United with Acustica 103, 2 (2017) 181–184 [CrossRef] [Google Scholar]
- H. Steffens, S. van de Par, S.D. Ewert: The role of early and late reflections on perception of source orientation. The Journal of the Acoustical Society of America 149, 4 (2021) 2255–2269 [CrossRef] [PubMed] [Google Scholar]
- A. Quélennec, P. Luizard: Pilot study on the influence of spatial resolution of human voice directivity on speech perception. Acta Acustica 6 (2022) 10 [CrossRef] [EDP Sciences] [Google Scholar]
- K.J. Bodon, T.W. Leishman: Development, evaluation, and validation of a high-resolution directivity measurement system for live musical instruments. The Journal of the Acoustical Society of America 138, 3 (2015) 1785–1785 [CrossRef] [Google Scholar]
- L. Aspöck, F. Brinkmann, D. Ackermann, S. Weinzierl, M. Vorländer: BRAS-benchmark for room acoustical simulation, 2019. https://doi.org/10.14279/depositonce-6726.2 [Google Scholar]
- D. Schröder: Physically Based Real-Time Auralization of Interactive Virtual Environments, Vol. 11. Logos Verlag Berlin GmbH, 2011 [Google Scholar]
- N.R. Shabtai, G. Behler, M. Vorländer, S. Weinzierl: Generation and analysis of an acoustic radiation pattern database for forty-one musical instruments. The Journal of the Acoustical Society of America 141, 2 (2017) 1246–1256 [CrossRef] [PubMed] [Google Scholar]
- J. Ahrens, S. Bilbao: Computation of spherical harmonic representations of source directivity based on the finite-distance signature. IEEE/ACM Transactions on Audio, Speech, and Language Processing 29 (2020) 83–92 [Google Scholar]
- M. Brandner, N. Meyer-Kahlen, M. Frank: Directivity pattern measurement of a grand piano for augmented acoustic reality, in: DAGA, 2020 [Google Scholar]
- T. Grothe, M. Kob: High resolution 3d radiation measurements on the bassoon, in: Proceedings of the International Symposium on Musical Acoustics, 2019 [Google Scholar]
- A.C. Marruffo, A. Mayer, A. Hofmann, V. Chatziioannou, W. Kausel: Experimental investigation of high-resolution measurements of directivity patterns, in: Proceedings of the 47th Annual Conference on Acoustics DAGA 2021, 2021 [Google Scholar]
- F. Zagala: Optimum-phase primal signal and radiation-filter modelling of musical instruments. Master thesis, Universität für Musik und Darstellende Kunst Graz, 2019 [Google Scholar]
- T. Deppisch, F. Zotter: Radiation Lobe Decomposition for Directivity Patterns. Fortschritte der Akustik, DAGA, Vienna, 2021, p. 5 [Google Scholar]
- K. Joshua Bodon, S.D. Bellows, T.W. Leishman: Musical instrument directivity, 2019. https://scholarsarchive.byu.edu/directivity/ [Google Scholar]
- F. Wefers: A free, open-source software package for directional audio data, in: Proceedings of the 36th German Annual Conference on Acoustics (DAGA 2010), Berlin, Germany, 2010 [Google Scholar]
- F. Brinkmann, A. Lindau, S. Weinzierl, G. Geissler, S. van de Par, M. Müller-Trapet, R. Opdam, M. Vorländer: The FABIAN Head-Related Transfer Function Data Base. Technische Universität Berlin, Berlin, 2017 [Google Scholar]
- F. Brinkmann, L. Aspöck, D. Ackermann, S. Lepa, M. Vorländer, S. Weinzierl: A round robin on room acoustical simulation and auralization. The Journal of the Acoustical Society of America 145, 4 (2019) 2746–2760 [CrossRef] [PubMed] [Google Scholar]
- W. Buchholtzer, J. Thilakan, M. Kob: The impact of acoustic environments on the perception of directivity of musical instruments, in: Proceedings of the 48th German Annual Conference on Acoustics (DAGA 2022), Stuttgart, Germany, 2022 [Google Scholar]
- International Telecommunication Union Radiocomminication Assembly: Methods for the subjective assessment of small impairments in audio systems. ITU-R Recommendation BS.1116-3, 2015 [Google Scholar]
- International Telecommunication Union: Method for the subjective assessment of intermediate quality level of audio systems. ITU-R Recommendation, 2015 [Google Scholar]
- T. Lokki, V. Pulkki: Evaluation of geometry-based parametric auralization, in: Audio Engineering Society Conference: 22nd International Conference: Virtual, Synthetic, and Entertainment Audio. Audio Engineering Society, 2002 [Google Scholar]
- P. Stade, J.M. Arend: A perception-based parametric model for synthetic late binaural reverberation. Fortschritte der Akustik–DAGA, 2016 [Google Scholar]
- T. Hidaka, L.L. Beranek, T. Okano: Interaural cross-correlation, lateral fraction, and low-and high-frequency sound levels as measures of acoustical quality in concert halls. The Journal of the Acoustical Society of America 98, 2 (1995) 988–1007 [CrossRef] [Google Scholar]
- T. Okano, L.L. Beranek, T. Hidaka: Relations among interaural cross-correlation coefficient (IACCE), lateral fraction (LFE), and apparent source width (ASW) in concert halls. The Journal of the Acoustical Society of America 104, 1 (1998) 255–265 [CrossRef] [PubMed] [Google Scholar]
- F. Wendt, M. Frank, F. Zotter, R. Höldrich: Directivity patterns controlling the auditory source distance, in: Proceedings of the 19th International Conference on Digital Audio Effects (DAFx-16), Brno, Czech Republic, 2016, pp. 5–9 [Google Scholar]
- A.W. Bronkhorst, T. Houtgast: Auditory distance perception in rooms. Nature 397, 6719 (1999) 517–520 [CrossRef] [PubMed] [Google Scholar]
- P. Zahorik: Assessing auditory distance perception using virtual acoustics. The Journal of the Acoustical Society of America 111, 4 (2002) 1832–1846 [CrossRef] [PubMed] [Google Scholar]
- E. Larsen, N. Iyer, C.R. Lansing, A.S. Feng: On the minimum audible difference in direct-to-reverberant energy ratio. The Journal of the Acoustical Society of America 124, 1 (2008) 450–461 [CrossRef] [PubMed] [Google Scholar]
- S. Klockgether, S. Van De Par: Just noticeable differences of spatial cues in echoic and anechoic acoustical environments. The Journal of the Acoustical Society of America 140, 4 (2016) EL352–EL357 [CrossRef] [PubMed] [Google Scholar]
- ISO: ISO 3382-1: Acoustics – Measurement of Room Acoustic Parameters. Part 1: Performance Spaces. ISO, 2009 [Google Scholar]
- M. Kato, H. Uematsu, M. Kashino, T. Hirahara: The effect of head motion on the accuracy of sound localization. Acoustical Science and Technology 24, 5 (2003) 315–317 [CrossRef] [Google Scholar]
- E. Hendrickx, P. Stitt, J.-C. Messonnier, J.-M. Lyzwa, B.F.G. Katz, C. de Boishéraud: Influence of head tracking on the externalization of speech stimuli for non-individualized binaural synthesis. The Journal of the Acoustical Society of America 141, 3 (2017) 2011–2023 [CrossRef] [PubMed] [Google Scholar]
- K.I. McAnally, R.L. Martin: Sound localization with head movement: implications for 3-d audio displays. Frontiers in Neuroscience 8 (2014) 210 [CrossRef] [PubMed] [Google Scholar]
Cite this article as: Corcuera-Marruffo A. Meyer-Kahlen N. & Lokki T. 2025. Audibility of reduced spatial resolution in musical instrument directivity. Acta Acustica, 9, 34. https://doi.org/10.1051/aacus/2025016.
All Tables
Reverberation time in seconds for different octave bands measured in the two rooms used in the listening test.
Summary of tested conditions for the listening test. Each condition was tested at five different spatial resolutions.
All Figures
|
Figure 1. Trumpet directivity at 2000 Hz and flute directivity at 630 Hz, truncated at different spherical harmonics orders (1, 2, 4, and 15), obtained from the BYU directivity database [27]. (a) Trumpet directivity at 2000 Hz, truncated at different spherical harmonics orders. (b) Flute directivity at 630 Hz, truncated at different spherical harmonics orders. |
| In the text | |
|
Figure 2. Models of the concert hall and shoebox room used in the listening test. The source position (S) is represented by a square and the receiver positions (R1, R2) by a circle. |
| In the text | |
|
Figure 3. Median difference grades and 99% confidence intervals for the trumpet in both source-listener positions and scenes, based on the full BRIR (including direct sound, early reflections, and late reverberation). (a) Concert Hall, Front (R2), Trumpet. (b) Concert Hall, Side (R1), Trumpet. (c) Shoebox, Front (R2), Trumpet. (d) Shoebox, Side (R1), Trumpet. |
| In the text | |
|
Figure 4. Median difference grades and 99% confidence intervals for the flute in both source-listener positions and scenes, based on the full BRIR (including direct sound, early reflections, and late reverberation). (a) Concert Hall, Front (R2), Flute. (b) Concert Hall, Side (R1), Flute. (c) Shoebox, Front (R2), Flute. (d) Shoebox, Side (R1), Flute. |
| In the text | |
|
Figure 5. Median difference grades and 99% confidence intervals for the flute and trumpet in the concert hall scene in position R1 when only the DS is changed. (a) Concert Hall, Side (R1), Flute. (b) Concert Hall, Side (R1), Trumpet. |
| In the text | |
|
Figure 6. Median difference grades and 99% confidence intervals for the flute and trumpet in the concert hall scene in both source-listener position when only the ER is changed. (a) Concert Hall, Front (R2), Trumpet. (b) Concert Hall, Side (R1), Trumpet. (c) Concert Hall, Front (R2), Flute. (d) Concert Hall, Side (R1), Flute. |
| In the text | |
|
Figure 7. Direct-to-reverberant energy ratio (DRR) for the trumpet and flute in both tested rooms in receiver position R2 and 1-IACCE scores for the trumpet and flute in both positions in the concert hall. (a) DRR. (b) 1-IACCE. |
| In the text | |
|
Figure 8. Room Transfer Functions for the trumpet and flute at various SH orders N in the shoebox room at position R1, smoothed in third-octave bands. (a) Shoebox, Side (R1), Trumpet. (b) Shoebox, Side (R1), Flute. |
| In the text | |
Current usage metrics show cumulative count of Article Views (full-text article views including HTML views, PDF and ePub downloads, according to the available data) and Abstracts Views on Vision4Press platform.
Data correspond to usage on the plateform after 2015. The current usage metrics is available 48-96 hours after online publication and is updated daily on week days.
Initial download of the metrics may take a while.