Figure 1
Download original image
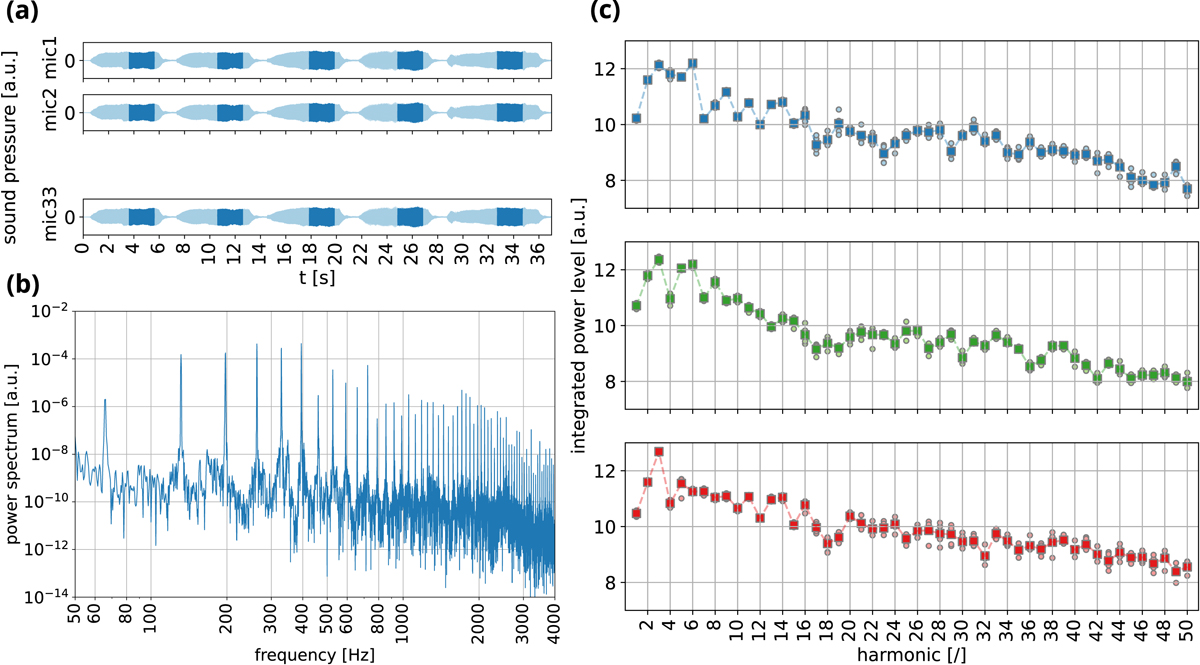
Steps of audio signal processing from acquisition to analyzable input. (a) The most stationary sections of tones are selected from multichannel recordings of sustained (bowed) notes. The power spectra of each section (appropriately windowed) are computed for each channel. (b) A typical power spectrum of the open C string with more than 50 well-defined harmonic peaks in the frequency interval from the fundamental (~65.6 Hz) to 4000 Hz, indicating a highly periodic, coherent oscillation over the entire duration. The powers in the harmonic peaks are integrated over their width and averaged over all channels (cf. the discussion in Ref. [53], p. 21, Sect. 3.3.1, 2nd paragraph). The logarithms of the peak-integrated and channel-averaged powers represent the harmonic vectors hi that form the input to the analysis. (c) Three such harmonic vectors corresponding to the open C string of three different celli: 5 repeated bow strokes (circles) and their level-average (squares). High and robust specificity of harmonic timbre is observed especially for the lower harmonic components – about 20 in the case of the cello’s C string.
Current usage metrics show cumulative count of Article Views (full-text article views including HTML views, PDF and ePub downloads, according to the available data) and Abstracts Views on Vision4Press platform.
Data correspond to usage on the plateform after 2015. The current usage metrics is available 48-96 hours after online publication and is updated daily on week days.
Initial download of the metrics may take a while.