Open Access
Figure 8
Download original image
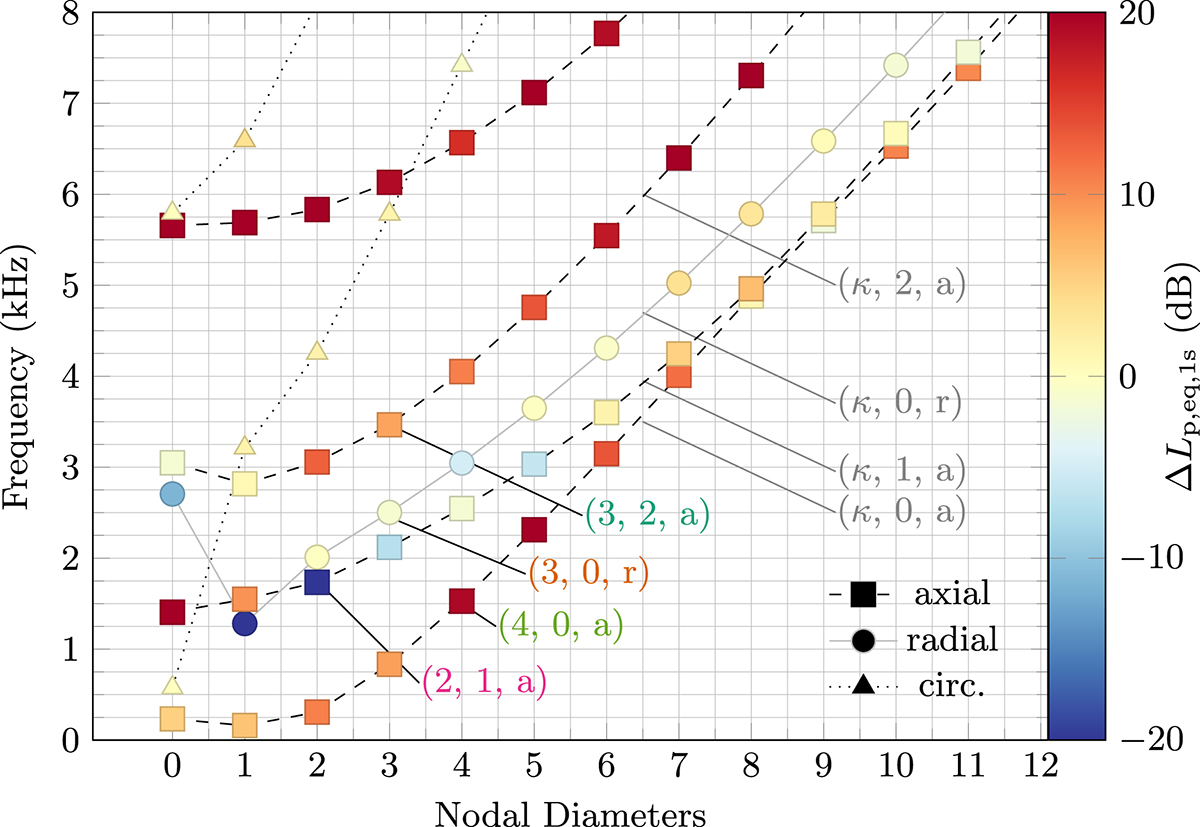
Dispersion diagram where each marker represents a mode of the wheel. The color indicates the difference in Lp,eq,1s is between excitation at Node 1 and Node 2, where positive differences correspond to larger radiation for an excitation at Node 2.
Current usage metrics show cumulative count of Article Views (full-text article views including HTML views, PDF and ePub downloads, according to the available data) and Abstracts Views on Vision4Press platform.
Data correspond to usage on the plateform after 2015. The current usage metrics is available 48-96 hours after online publication and is updated daily on week days.
Initial download of the metrics may take a while.