Figure 12
Download original image
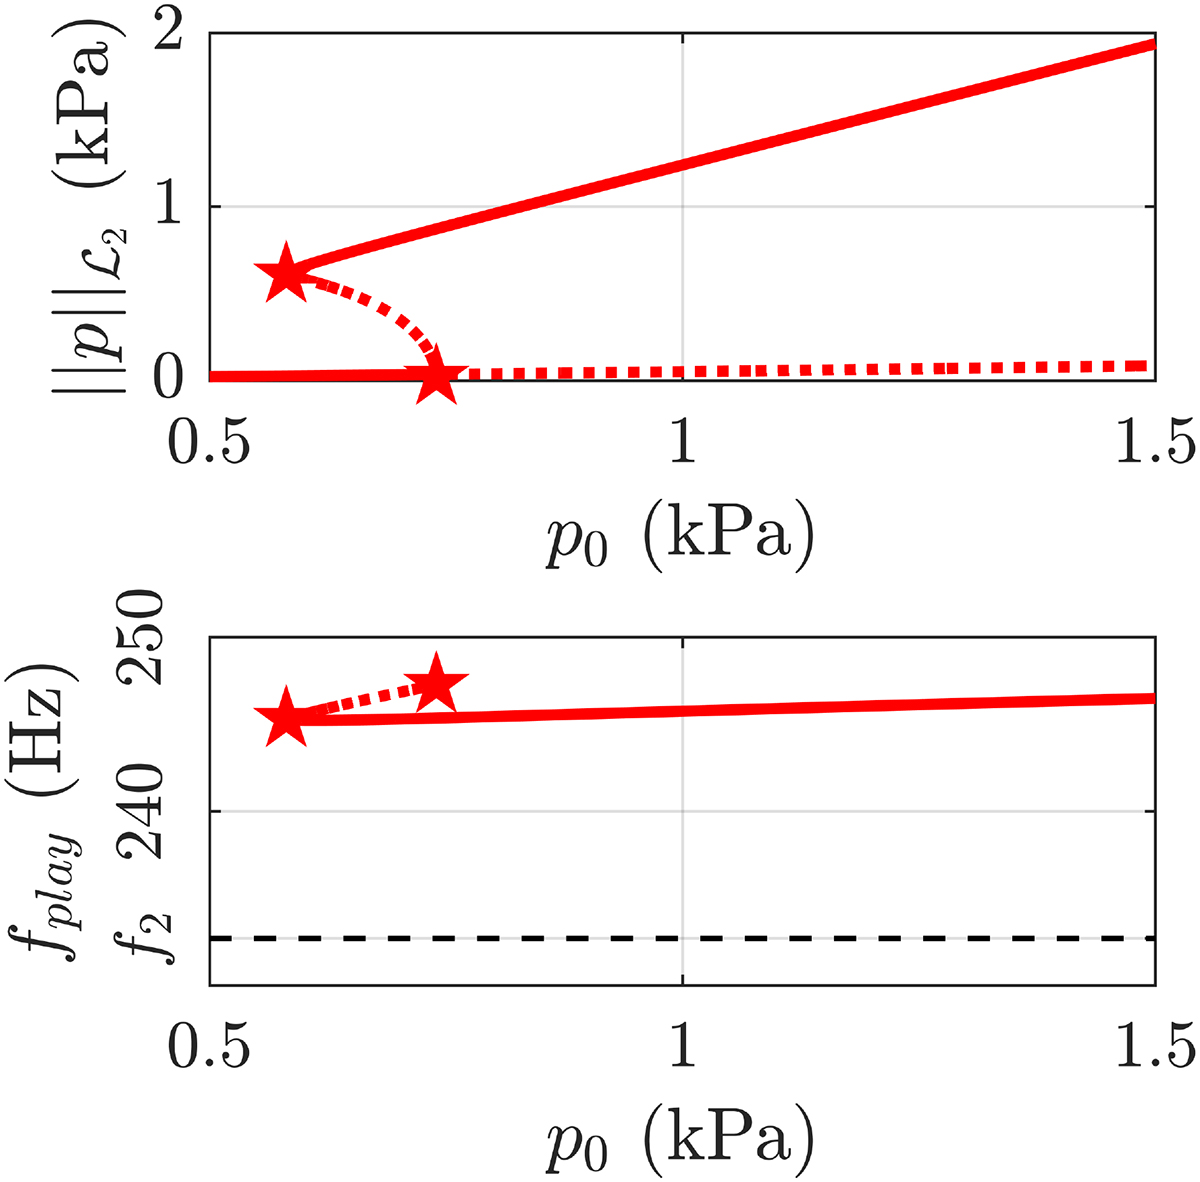
Bifurcation diagram of the 11-mode trumpet model, calculated with Manlab. Top pane: amplitude of the oscillations ![]() versus blowing pressure p0. Bottom pane: fundamental frequency of the oscillations fplay versus blowing pressure p0. Stable solutions are shown as solid lines, unstable solutions as dotted lines. Bifurcations are represented by stars.
versus blowing pressure p0. Bottom pane: fundamental frequency of the oscillations fplay versus blowing pressure p0. Stable solutions are shown as solid lines, unstable solutions as dotted lines. Bifurcations are represented by stars.
Current usage metrics show cumulative count of Article Views (full-text article views including HTML views, PDF and ePub downloads, according to the available data) and Abstracts Views on Vision4Press platform.
Data correspond to usage on the plateform after 2015. The current usage metrics is available 48-96 hours after online publication and is updated daily on week days.
Initial download of the metrics may take a while.