Figure 13
Download original image
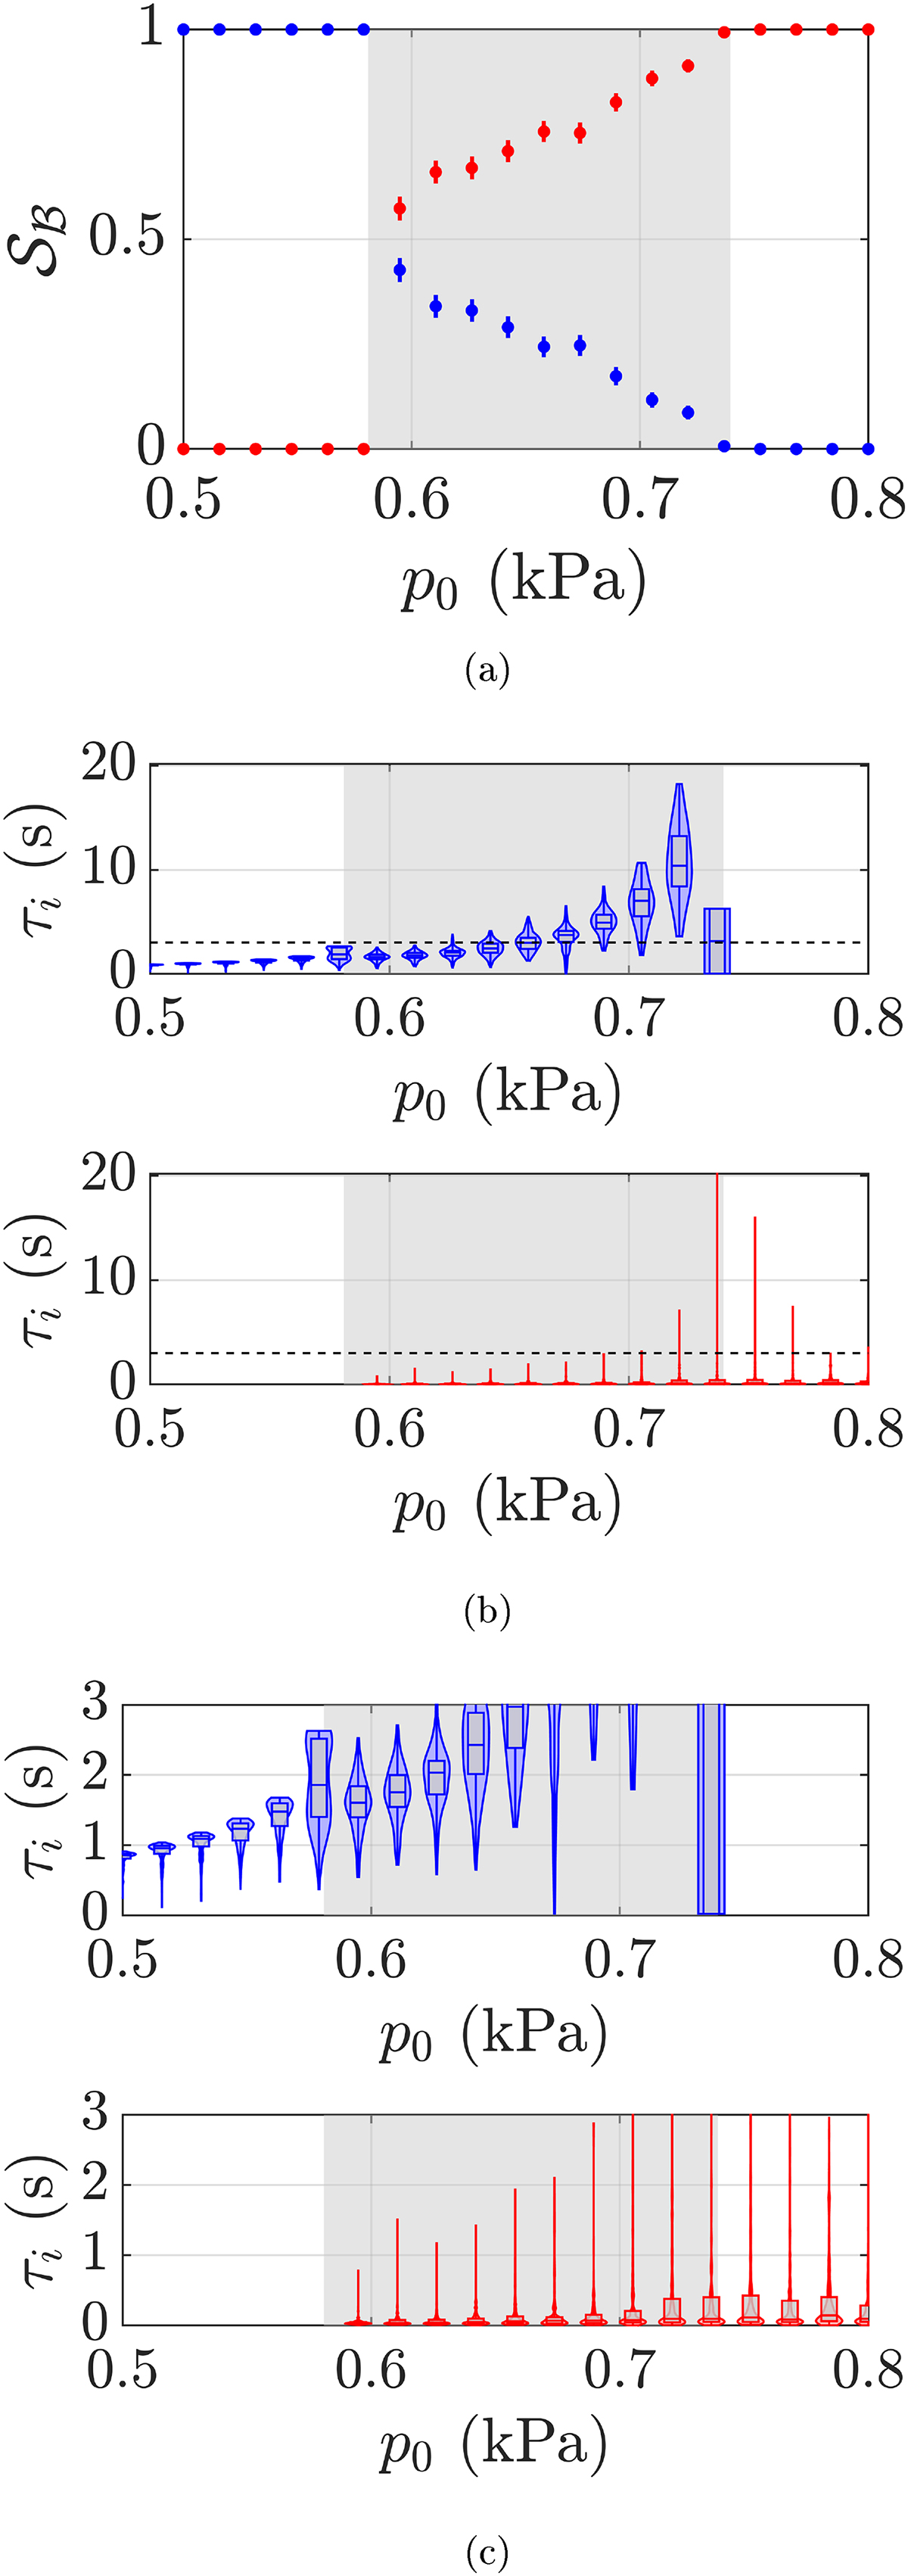
Basin stability (a) and transient duration distributions (b) of the trumpet model calculated with a uniform ![]() distribution of N = 300 initial conditions. The dotted lines in (b) indicate the limit of the scale used for the zoomed view in (c). Error bars are given by the equation (7).
distribution of N = 300 initial conditions. The dotted lines in (b) indicate the limit of the scale used for the zoomed view in (c). Error bars are given by the equation (7).
Current usage metrics show cumulative count of Article Views (full-text article views including HTML views, PDF and ePub downloads, according to the available data) and Abstracts Views on Vision4Press platform.
Data correspond to usage on the plateform after 2015. The current usage metrics is available 48-96 hours after online publication and is updated daily on week days.
Initial download of the metrics may take a while.