Figure B1
Download original image
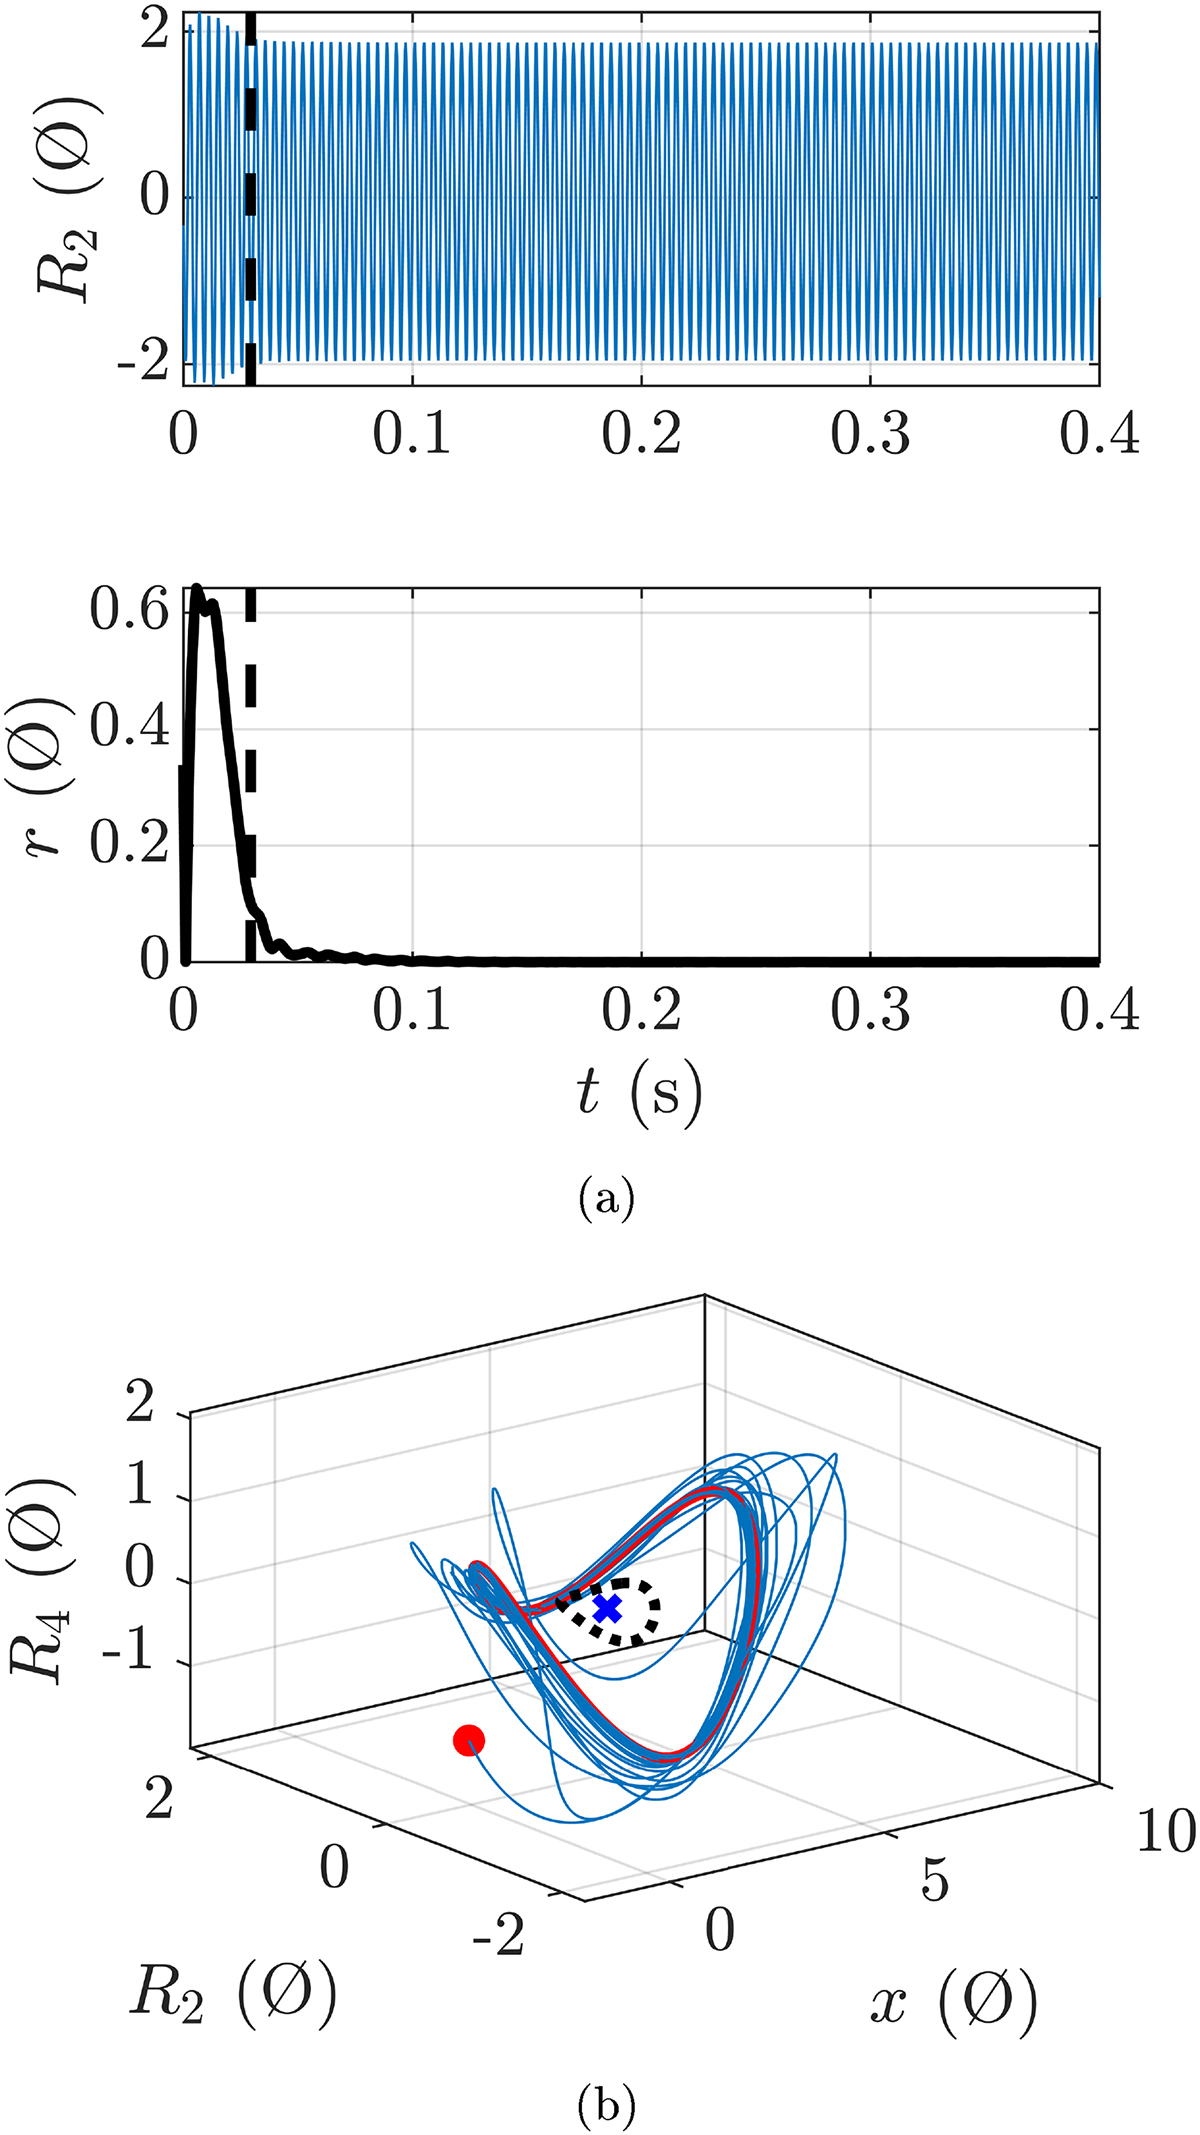
(a) Computation of the transient duration (represented by the dotted line) and (b) projection of the corresponding trajectory along x, R2 and R4. The red dot is the initial state, the blue cross is the equilibrium, the red line is the stable periodic solution and the black broken line is the unstable periodic solution.
Current usage metrics show cumulative count of Article Views (full-text article views including HTML views, PDF and ePub downloads, according to the available data) and Abstracts Views on Vision4Press platform.
Data correspond to usage on the plateform after 2015. The current usage metrics is available 48-96 hours after online publication and is updated daily on week days.
Initial download of the metrics may take a while.