Figure 6
Download original image
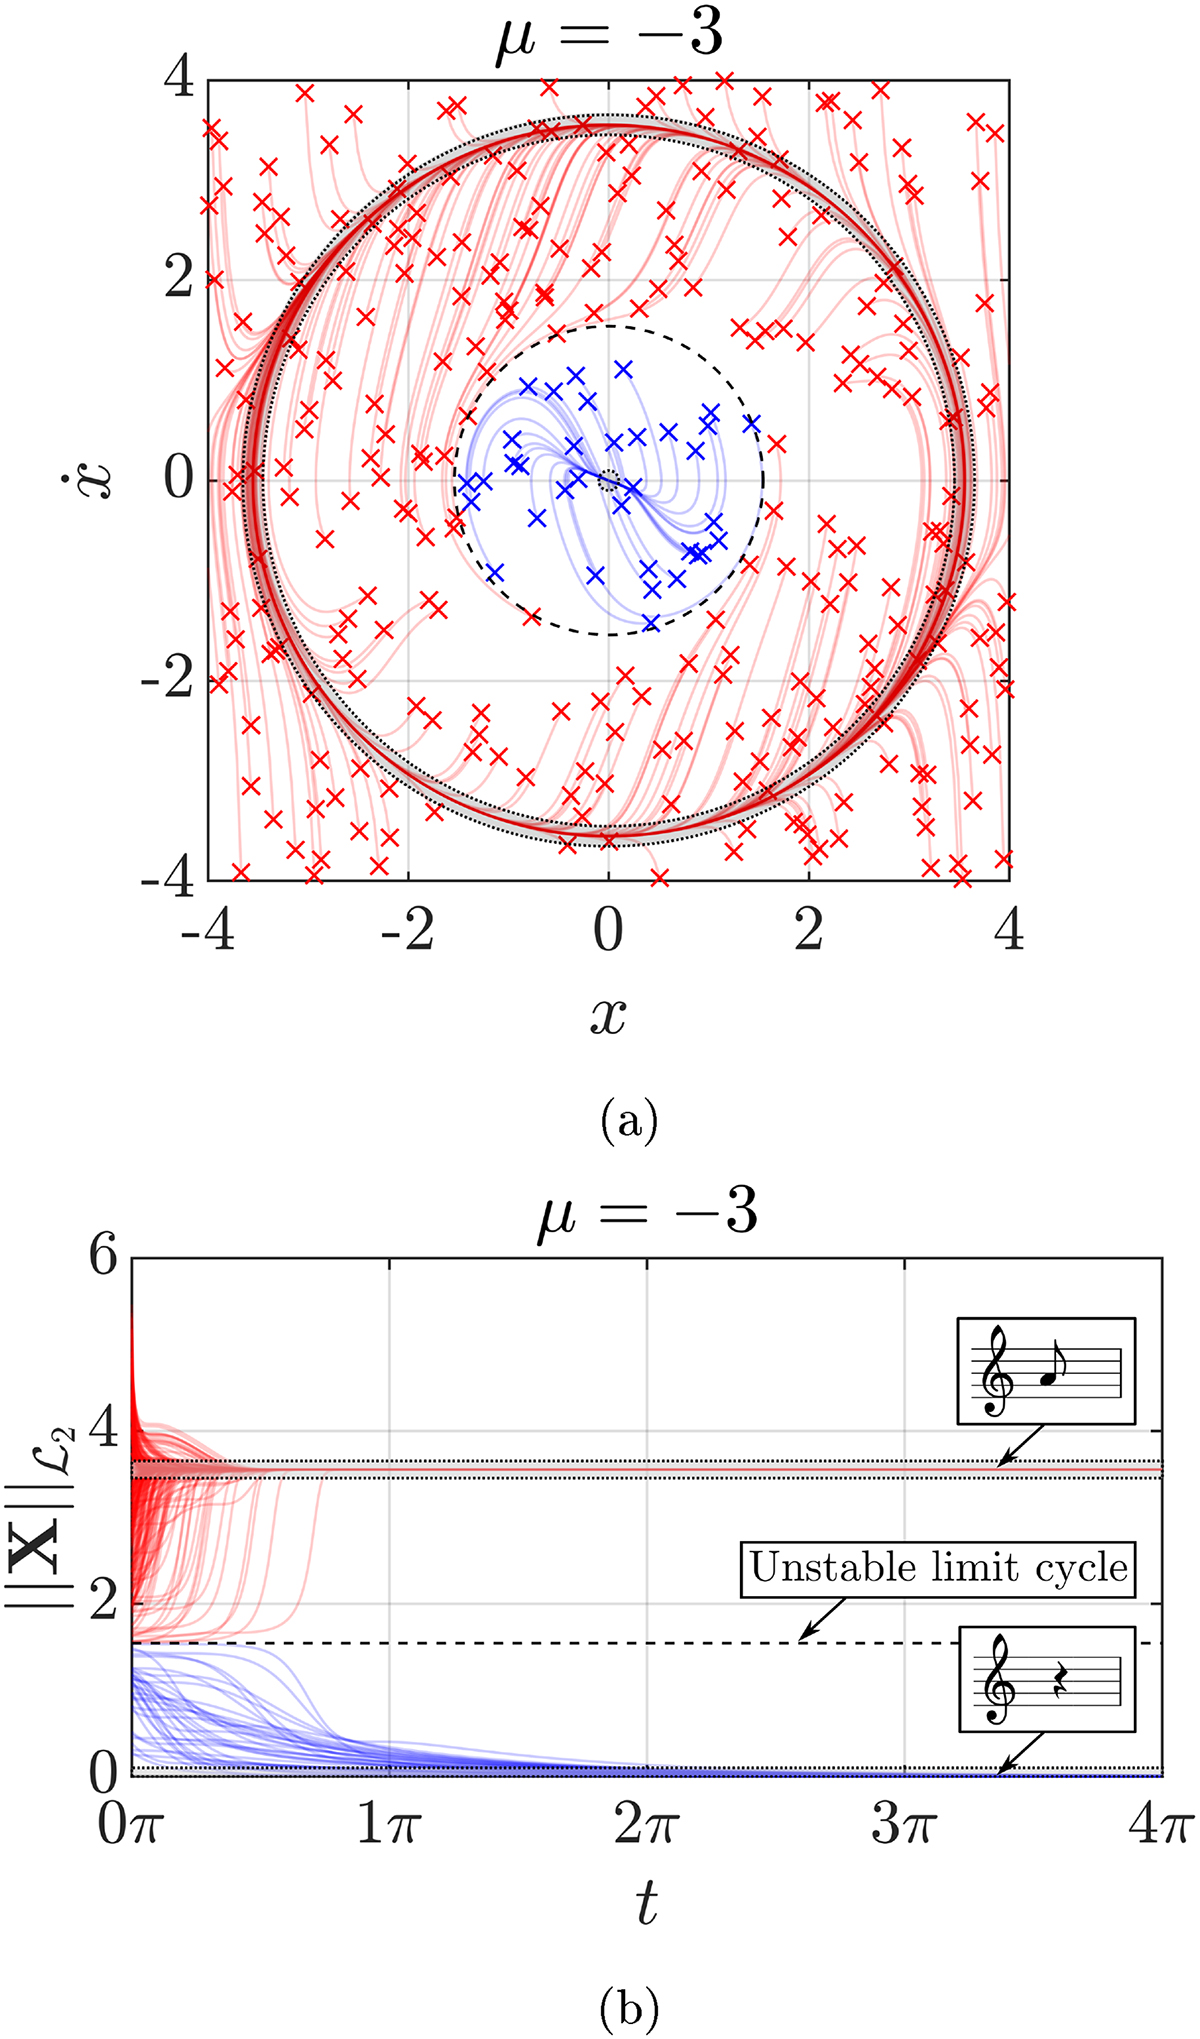
(a) Phase trajectories and (b) time evolution of the associated norm of the system’s state for 300 random initial conditions. Blue trajectories lead to the equilibrium and red trajectories lead to the periodic solution. The neighborhoods of the two stable solutions are shaded in grey. They are defined at a distance ε = 0.1 in ![]() -norm from the stable solutions.
-norm from the stable solutions.
Current usage metrics show cumulative count of Article Views (full-text article views including HTML views, PDF and ePub downloads, according to the available data) and Abstracts Views on Vision4Press platform.
Data correspond to usage on the plateform after 2015. The current usage metrics is available 48-96 hours after online publication and is updated daily on week days.
Initial download of the metrics may take a while.