Figure 8
Download original image
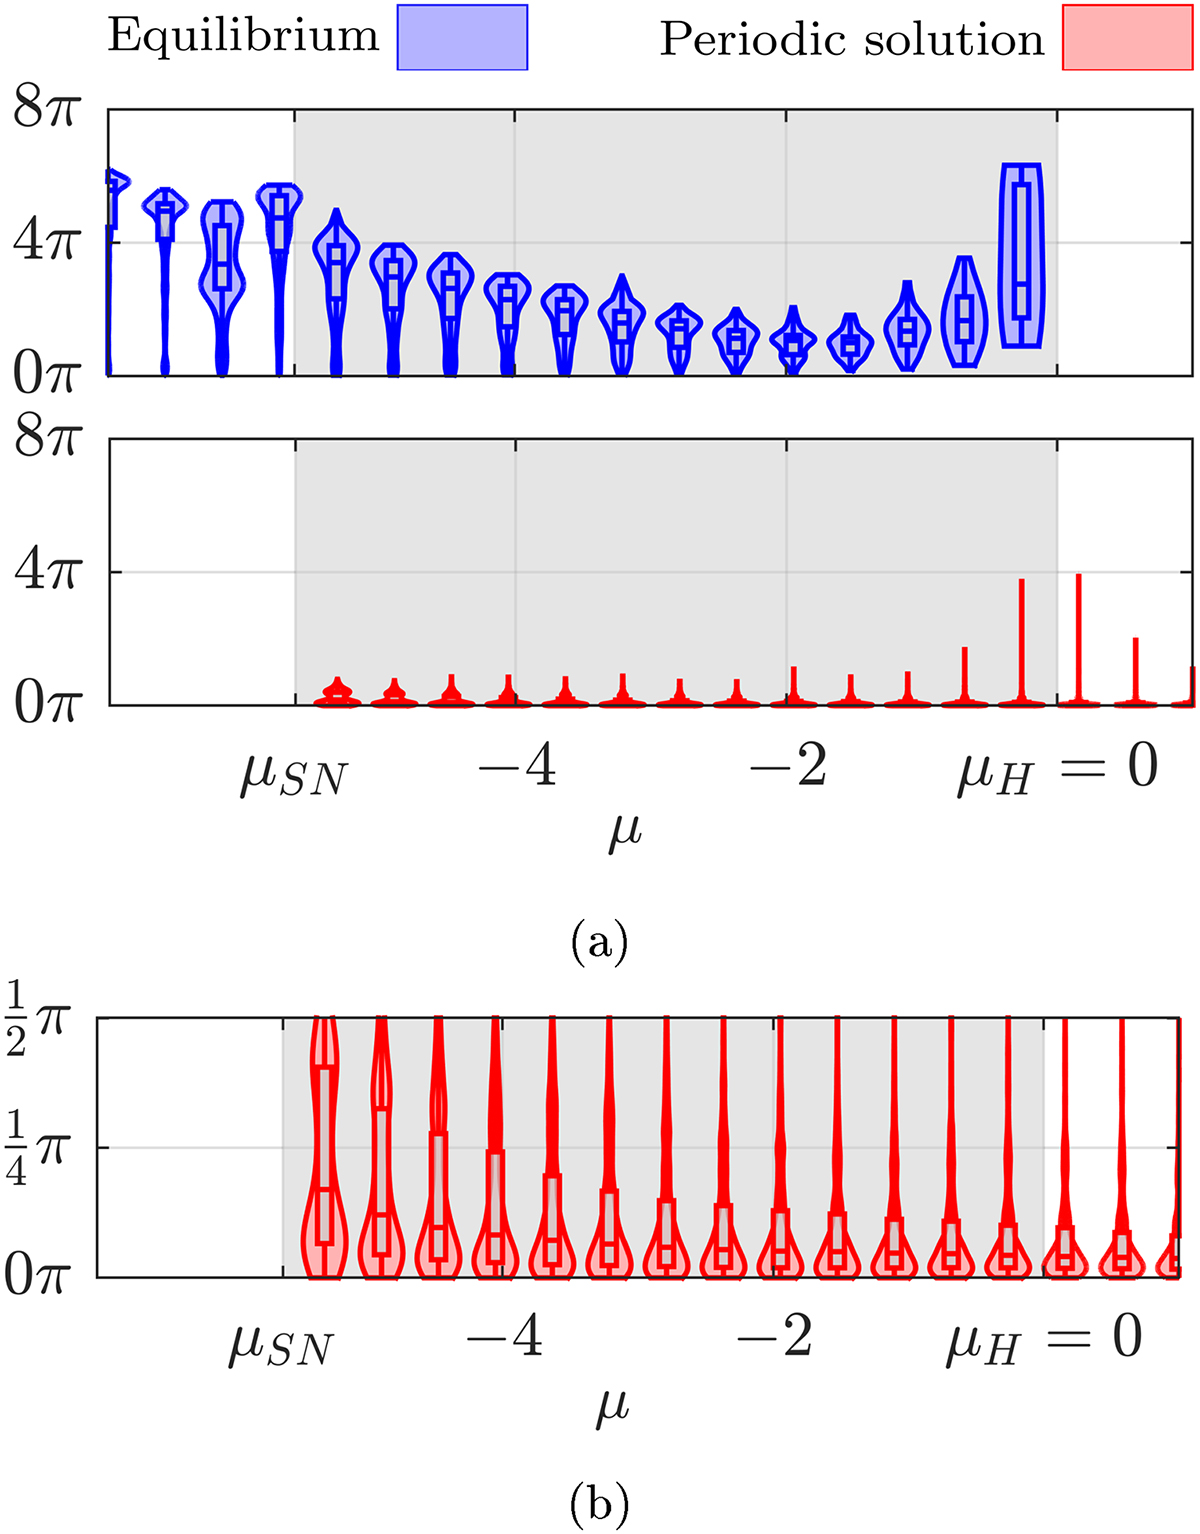
Violin plots of the transient duration with respect to the control parameter μ. In blue: equilibrium. In red: periodic solution. Number of samples: N = 1000. Panel (b) is a magnified version of the transients leading to the periodic solution. The region of multistability is shaded in grey.
Current usage metrics show cumulative count of Article Views (full-text article views including HTML views, PDF and ePub downloads, according to the available data) and Abstracts Views on Vision4Press platform.
Data correspond to usage on the plateform after 2015. The current usage metrics is available 48-96 hours after online publication and is updated daily on week days.
Initial download of the metrics may take a while.