Figure 5
Download original image
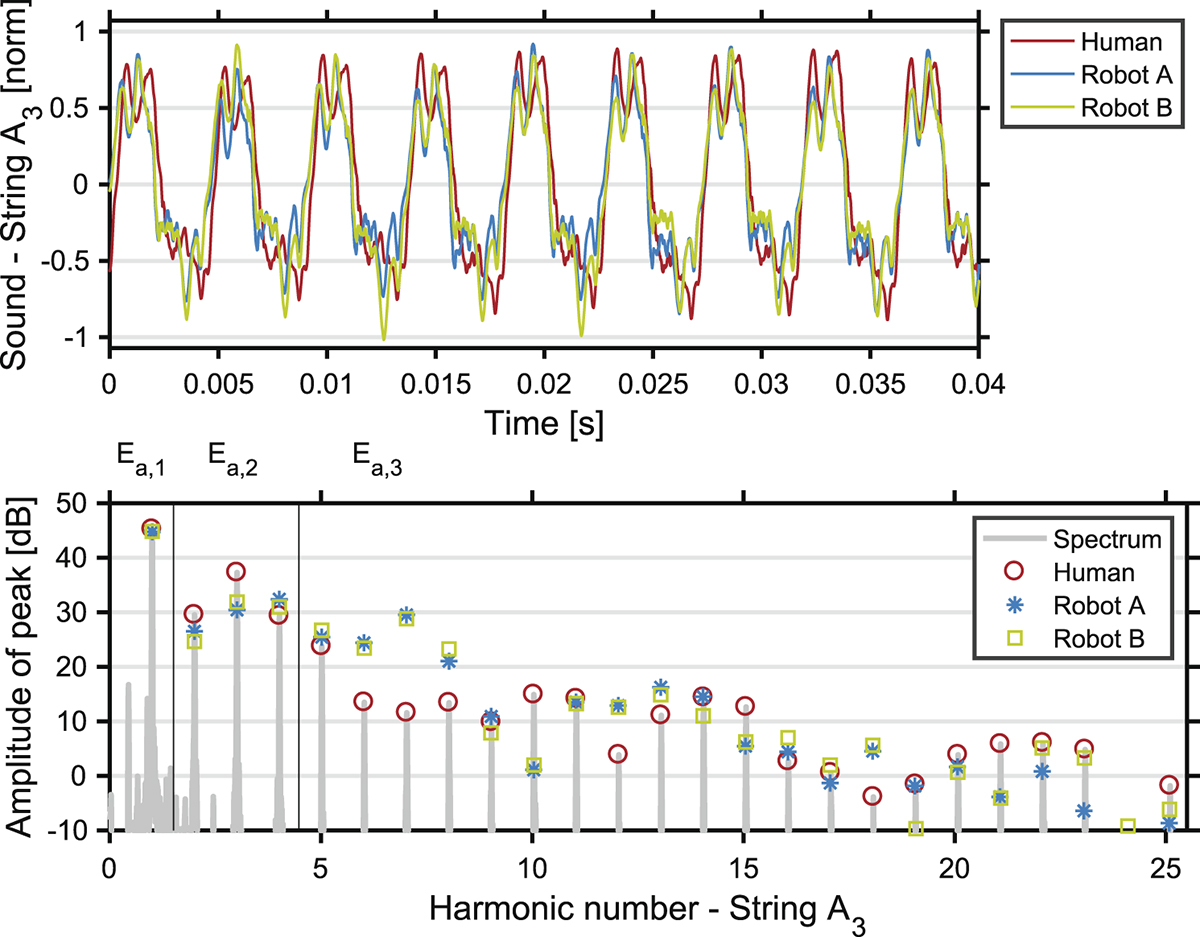
Waveform (top) and harmonic peaks (bottom) comparing human and robotic playing at string A3. The spectrum frequency-axis is given as normalised by the fundamental frequency (so that the peaks align with each harmonic number). The spectrum of the human-played tone is plotted in gray for better visualisation. The vertical lines separate the harmonic peaks used for the errors Ea,1, Ea,2 and Ea,3.
Current usage metrics show cumulative count of Article Views (full-text article views including HTML views, PDF and ePub downloads, according to the available data) and Abstracts Views on Vision4Press platform.
Data correspond to usage on the plateform after 2015. The current usage metrics is available 48-96 hours after online publication and is updated daily on week days.
Initial download of the metrics may take a while.