Figure 6
Download original image
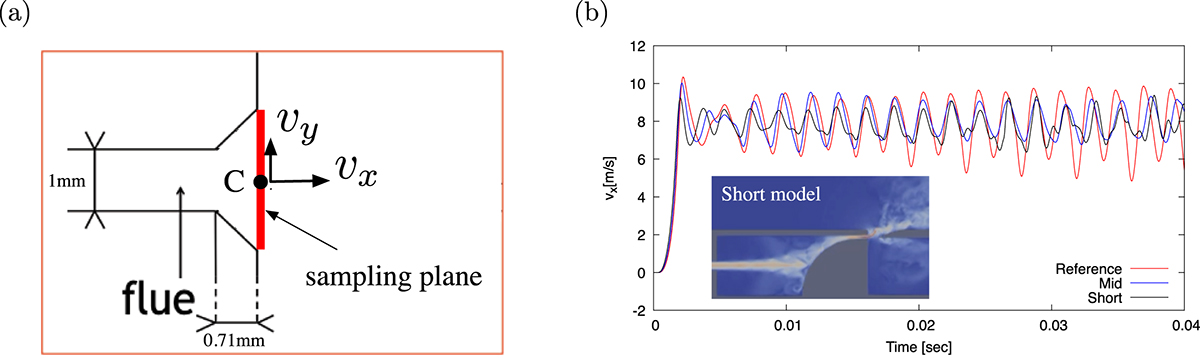
Jet velocity (vx, vy) at the flue exit. (a) The observation point C at the center of the flue exit and the sampling plane (the cross-section of the flue opening) over which vx and vy are integrated to obtain the averaged values ![]() and
and ![]() , respectively. (b) Fluctuations of vx at the point C for the three models. The inset shows the velocity distribution at t = 0.04 s in the operating portion for the Short model.
, respectively. (b) Fluctuations of vx at the point C for the three models. The inset shows the velocity distribution at t = 0.04 s in the operating portion for the Short model.
Current usage metrics show cumulative count of Article Views (full-text article views including HTML views, PDF and ePub downloads, according to the available data) and Abstracts Views on Vision4Press platform.
Data correspond to usage on the plateform after 2015. The current usage metrics is available 48-96 hours after online publication and is updated daily on week days.
Initial download of the metrics may take a while.