Figure 10
Download original image
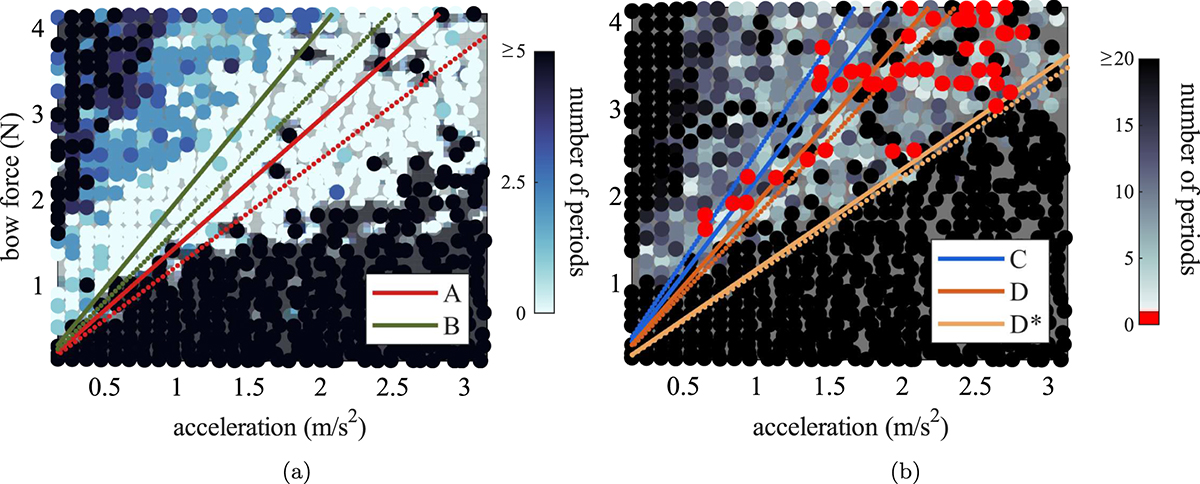
Comparison between Guettler theoretical limits and measured transient times in the Guettler diagram from Section 3.1. In (a) the plot displays the duration between the first slip and the first instance of Helmholtz motion regardless of whether this motion is sustained. Conditions A and B are overlaid on the plot (solid and dashed lines). Two sets of friction coefficients are used to illustrate their influence on these conditions. The dotted lines represent the conditions computed with lower friction coefficients compared to the solid lines. In (b) the transient time is displayed as in Figure 6, but uses a colour scheme optimised for displaying multiple lines. Here, “perfect” transients (lasting 0-1 period length) are highlighted in red. Notably, these “perfect” transients fall largely within the region bounded by conditions C and D*.
Current usage metrics show cumulative count of Article Views (full-text article views including HTML views, PDF and ePub downloads, according to the available data) and Abstracts Views on Vision4Press platform.
Data correspond to usage on the plateform after 2015. The current usage metrics is available 48-96 hours after online publication and is updated daily on week days.
Initial download of the metrics may take a while.