Figure 11
Download original image
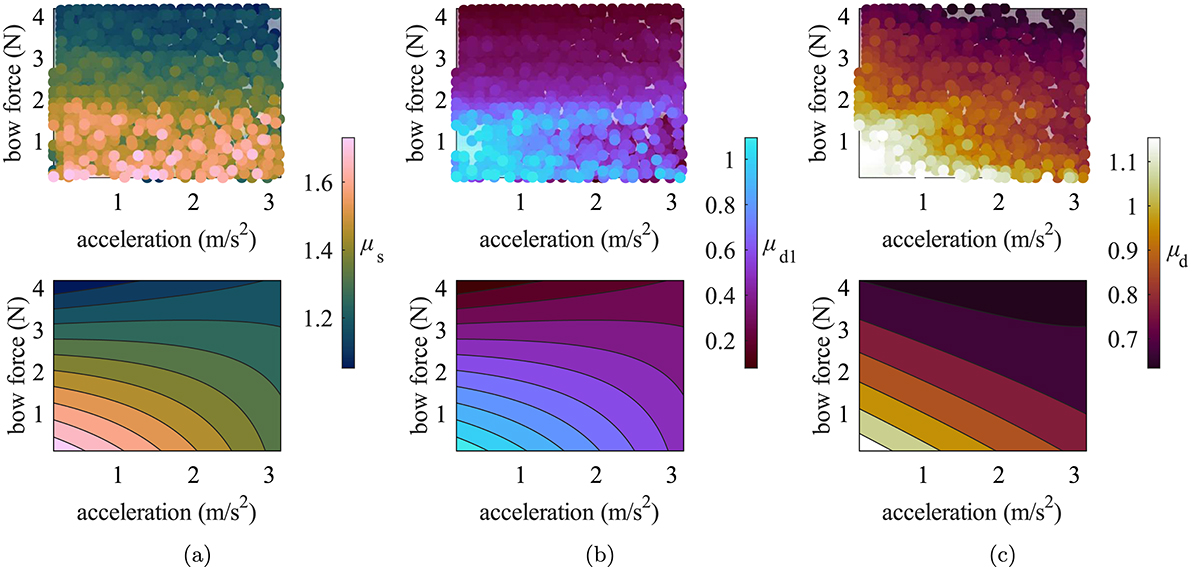
Measured friction coefficients obtained from the bridge force signals. The plots at the top show the measured friction coefficients, while the ones at the bottom represent the second-order polynomial fits to the measured friction coefficients using equation (5). (a) Static friction coefficient μs. (b) Dynamic friction coefficient at the first slip μd1. (c) Averaged “dynamic” friction coefficient μd, computed by taking the ratio of the average bridge force on the bowing plane and the average bridge force on the perpendicular plane over a 0.1 s time window.
Current usage metrics show cumulative count of Article Views (full-text article views including HTML views, PDF and ePub downloads, according to the available data) and Abstracts Views on Vision4Press platform.
Data correspond to usage on the plateform after 2015. The current usage metrics is available 48-96 hours after online publication and is updated daily on week days.
Initial download of the metrics may take a while.