Figure 12
Download original image
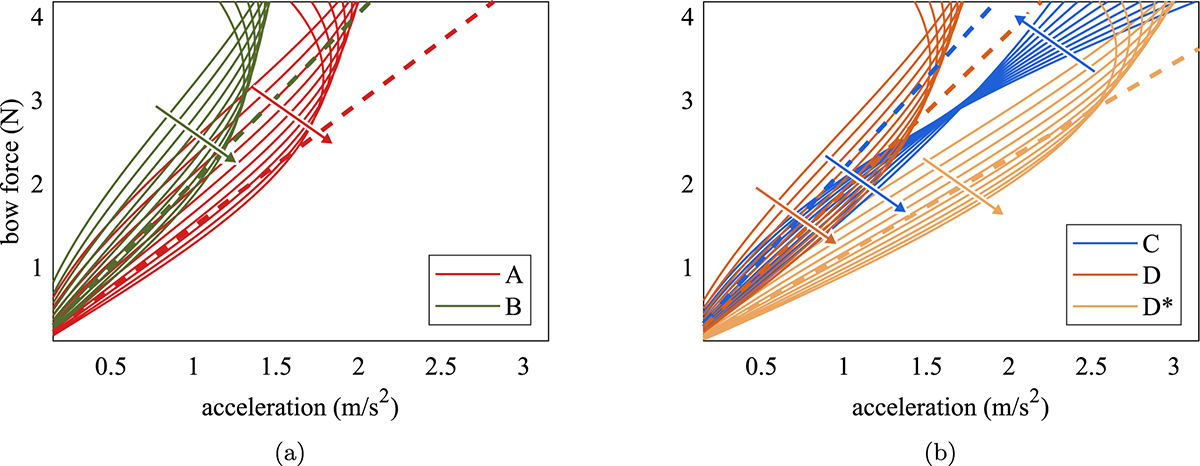
Guettler limits computed using friction coefficients obtained from measurements. Conditions A and B are shown in (a), while conditions C, D, and D* are displayed in (b). Ten increasing values of ![]() were employed, ranging from 0.15 ms−2 to 3.15 ms−2, as indicated by the arrows. For comparison, dashed lines represent limits computed with a fixed set of friction coefficients (μs = 1, μd = 0.5, μd1 = 0.4, μd2 = 0.3) used in Figure 10.
were employed, ranging from 0.15 ms−2 to 3.15 ms−2, as indicated by the arrows. For comparison, dashed lines represent limits computed with a fixed set of friction coefficients (μs = 1, μd = 0.5, μd1 = 0.4, μd2 = 0.3) used in Figure 10.
Current usage metrics show cumulative count of Article Views (full-text article views including HTML views, PDF and ePub downloads, according to the available data) and Abstracts Views on Vision4Press platform.
Data correspond to usage on the plateform after 2015. The current usage metrics is available 48-96 hours after online publication and is updated daily on week days.
Initial download of the metrics may take a while.