Figure 7
Download original image
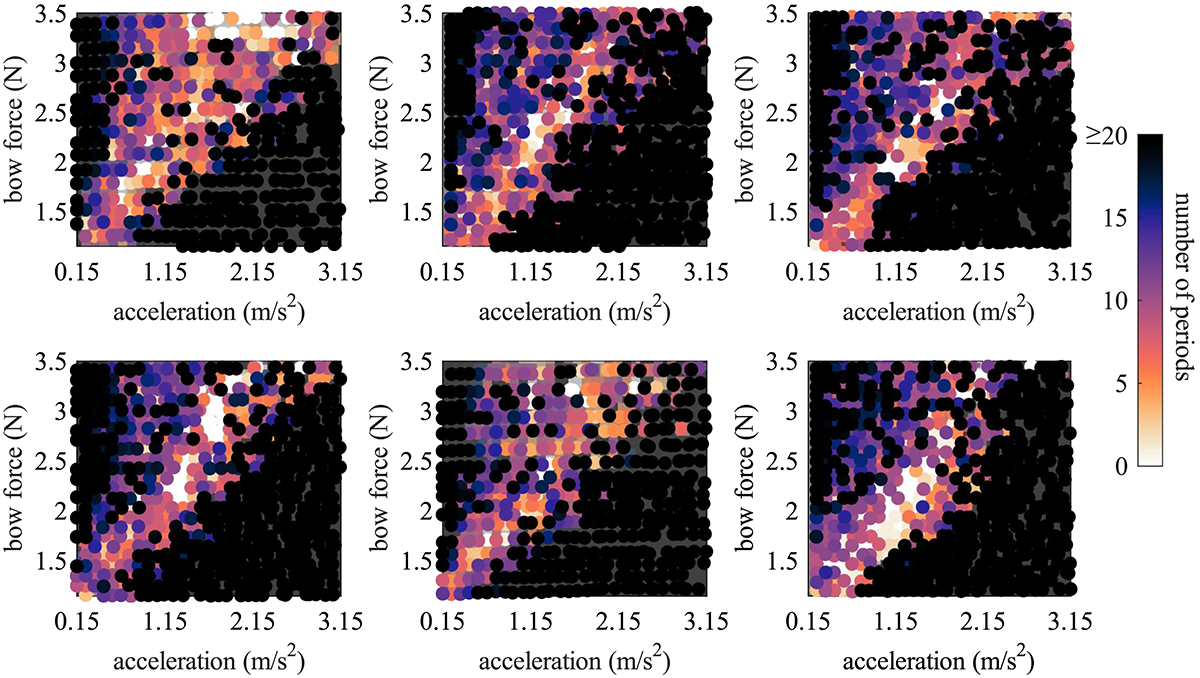
Six repetitions of the Guettler diagram. To facilitate visual comparison across plots, the y-axis has been cropped to accommodate the same force values in each plot. The top-left plot is identical to Figure 6 and serves as a reference. The remaining plots depict Guettler diagrams acquired by systematically varying bowing parameters in either ascending (top row) or descending (bottom row) order during the measurement sessions. The left and centre columns show results obtained on consecutive days without removing the string from the apparatus. The rightmost column displays Guettler diagrams measured after a one-month interval, with the string having been dismounted and remounted in the meantime.
Current usage metrics show cumulative count of Article Views (full-text article views including HTML views, PDF and ePub downloads, according to the available data) and Abstracts Views on Vision4Press platform.
Data correspond to usage on the plateform after 2015. The current usage metrics is available 48-96 hours after online publication and is updated daily on week days.
Initial download of the metrics may take a while.