Figure 8
Download original image
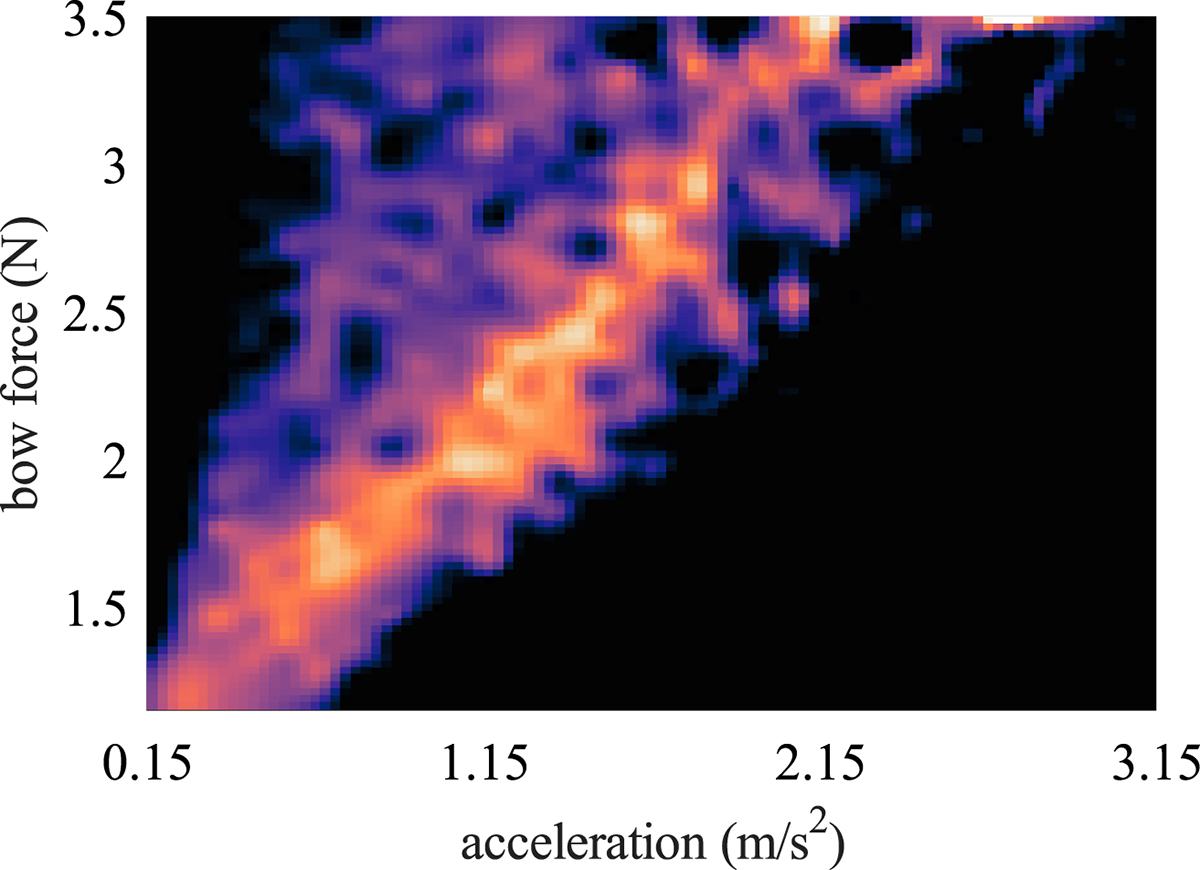
Average pre-Helmholtz transient time across the six repetitions shown in Figure 7. To create this visualisation, each of the six individual Guettler diagrams was first interpolated onto a common grid with 100 rows and 100 columns. Following interpolation, the average transient time was calculated for each grid point by taking the mean value across all repetitions. The observed “brighter” region represents a zone where the bow-string interaction generally leads to shorter pre-Helmholtz transient times.
Current usage metrics show cumulative count of Article Views (full-text article views including HTML views, PDF and ePub downloads, according to the available data) and Abstracts Views on Vision4Press platform.
Data correspond to usage on the plateform after 2015. The current usage metrics is available 48-96 hours after online publication and is updated daily on week days.
Initial download of the metrics may take a while.