Figure 1
Download original image
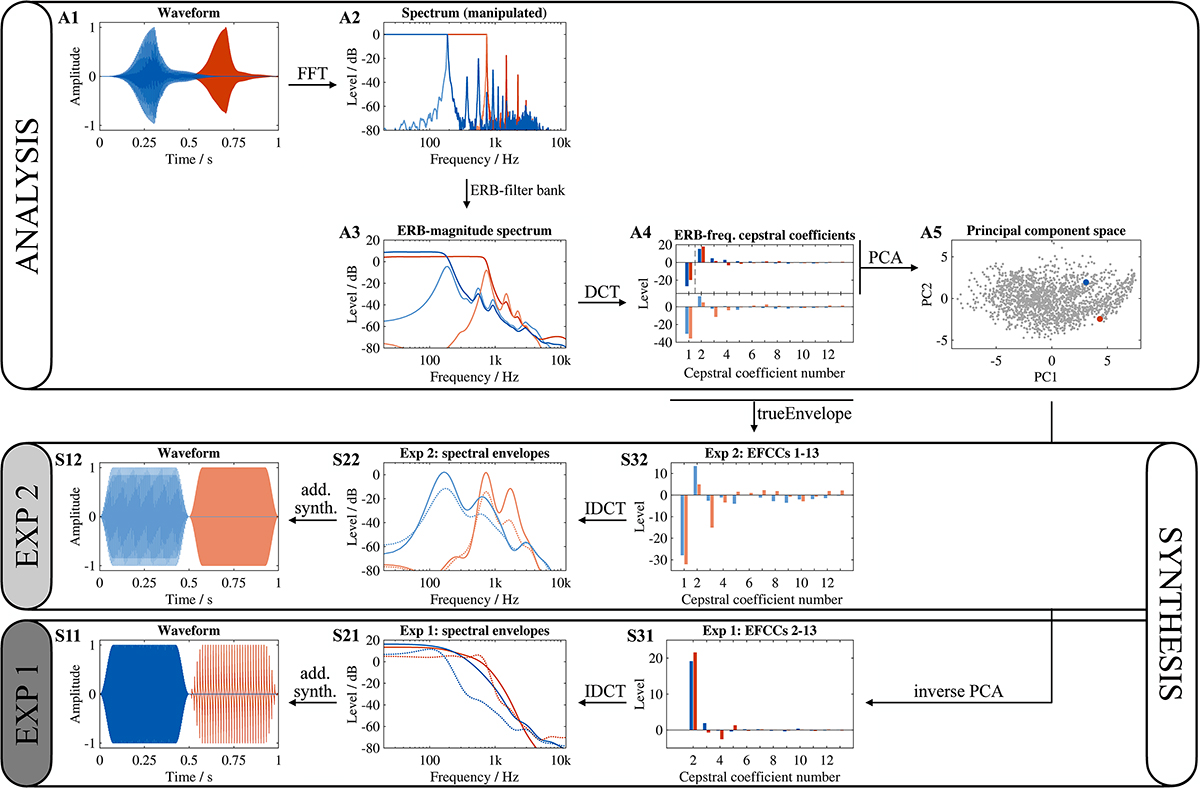
Overview of the analysis and synthesis process. Darker colors correspond to diagrams for Experiment 1 and lighter colors for Experiment 2. [A1] Original waveform, here for a low [F♯3] and high [F♯5] note of a clarinet. Waveforms are only shifted along the time axis for visualization purposes. [A2] Long-term spectra from a fast Fourier transform [FFT] with a frequency resolution of 1 Hz; with (dark) and without (light) manipulation. [A3] ERB-magnitude spectra (RMS-normalized) for manipulated (dark) and original (light) spectra. [A4] ERB-frequency cepstral coefficients (EFCCs) 1 to 13 from a discrete cosine transform (DCT, type II). The lower graph corresponds to the original spectra and the upper to the manipulated spectra. CC1 [manipulated) was left out in the subsequent analysis as indicated by the dashed vertical line in the upper graph. [A5] Two-dimensional latent space from principal component analysis (PCA) on CCs 2 to 13. Smaller gray dots correspond to all analyzed notes across the data set. Experiment 2: [S32] Adjusted EFCCs from true envelope computation. [S22] Spectral envelopes from an inverse discrete cosine transform (IDCT); dotted lines correspond to the original EFCCs from A4 compared to the true envelope as solid lines. [S12] Synthesized waveforms from additive synthesis of harmonics underneath the spectral envelopes. Experiment 1: [S31] Reconstructed EFCCs after dimensionality reduction from the two-dimensional latent space. [S21] Spectral envelopes from an IDCT; dotted lines correspond to the EFCCs of the manipulated spectra in A4 compared to the approximated spectral envelopes from the latent space as solid lines. [S11] Synthesized waveforms from additive synthesis of harmonics underneath the spectral envelopes.
Current usage metrics show cumulative count of Article Views (full-text article views including HTML views, PDF and ePub downloads, according to the available data) and Abstracts Views on Vision4Press platform.
Data correspond to usage on the plateform after 2015. The current usage metrics is available 48-96 hours after online publication and is updated daily on week days.
Initial download of the metrics may take a while.