| Issue |
Acta Acust.
Volume 9, 2025
|
|
|---|---|---|
| Article Number | 5 | |
| Number of page(s) | 14 | |
| Section | Musical Acoustics | |
| DOI | https://doi.org/10.1051/aacus/2024082 | |
| Published online | 20 January 2025 | |
Scientific Article
Characterization of single reed mouthpiece interaction in quasi-static regime
1
Laboratoire d’Acoustique de l’Université du Mans (LAUM), UMR 6613, Institut d’Acoustique-Graduate School (IA-GS), CNRS, Le Mans Université, Avenue O. Messiaen, CEDEX 09, 72085 Le Mans, France
2
University of Applied Sciences and Arts Northwestern Switzerland, Musik-Akademie Basel, Academy of Music, Schola Cantorum Basiliensis, Leonhardsstr. 6, 4051 Basel, Switzerland
* Corresponding author: This email address is being protected from spambots. You need JavaScript enabled to view it.
Received:
25
July
2022
Accepted:
12
November
2024
Abstract
This paper describes an experimental measurement setup for the characterization of single-reed mouthpiece interaction under quasi-static conditions. Measurement leads to the estimation of the nonlinear characteristics, establishing the relation between pressure drop across the reed channel and the jet cross-section. Measurements with various lip forces show that the resultant nonlinear characteristics can be described by a single nonlinear characteristic linking the generalized pressure and the jet cross-section. This generalized pressure is the sum of the pressure drop and the lip pressure, defined as the lip force divided by an equivalent lip surface determined for each reed. The nonlinear characteristic is then modeled as a function depending on three parameters: the opening at rest, the linear stiffness for low pressures, and the “elbow pressure,” which allows to make the link between the two affine parts of the function. The characterization of 24 tenor saxophone reeds shows that the model fits the experimental characteristics with an inaccuracy that can be considered as a supplementary parameter for the reed. Finally, the reeds can be characterized with with only five parameters, the inaccuracy, the lip equivalent surface and the three parameters of the nonlinear model. First results suggest that equivalent lip surface and inaccuracy depends on the reed type while reed opening at rest and linear stiffness depends on the reed.
Key words: Woodwinds / Single cane reed / Experimental characterization / Nonlinear stiffness
© The Author(s), Published by EDP Sciences, 2025
 This is an Open Access article distributed under the terms of the Creative Commons Attribution License (https://creativecommons.org/licenses/by/4.0), which permits unrestricted use, distribution, and reproduction in any medium, provided the original work is properly cited.
List of symbols
Latin
Ar: Reed equivalent surface (m2)
C: Reed aerostatic compliance (m4 N−1)
Cm: Reed mechanical compliance (m2 N−1)
F: Lip force (depending on pressure drop Δp for a constant lip force F0) (N)
F0: Static lip force (F = F0 for Δp = 0) (N)
Fg: Generalized lip force (N)
h: Reed channel height (m)
p: Mouthpiece pressure (Pa)
Pe: Elbow pressure (Pa)
Pm: Mouth pressure (Pa)
PM: Static reed closure pressure (Pa)
S: Effective jet cross-section (m2)
Sd: Section of the measurement diaphragm (m2)
Sf: Front reed channel opening section (m2)
Sr: Section of the reference diaphragms (m2)
S00: Effective reed channel opening section for F = 0 and Δp = 0 (m2)
U: Volume flow entering the resonator (m3 s−1)
Uc: Volume flow in the reed channel (m3 s−1)
w: Reed channel width (m)
xL: Lip position along reed main axis (m)
yL: Lip position along reed transverse axis (m)
Z: Resonator impedance (kg m−4 s−1)
Greek
Δp = Pm – p: Pressure drop across the reed channel (Pa)
Δpg: Generalized pressure drop across the reed channel (Pa)
ΔpU: Pressure drop across the volume velocity sensor (Pa)
ρ: Air density (kg m−3)
1 Introduction
The reed is a crucial part of reed wind instruments and is often a major concern for musicians. It can influence the ease of playing, timbre, stability of intonation, the ability to play a particular note pianissimo or fortissimo, etc. Thus, the musician expects a wide range of qualities which are not always met. For single reeds, the musician usually does not intervene in its manufacture. When buying reeds, musicians can choose the material (cane, synthetic such as carbon fiber, polymer, …), the brand, the cut (i.e. the geometrical shape) and the strength.
Different cuts are made for reeds used in jazz or classical music [1, 2]. According to a reed manufacturer [1], these cuts allow for the playing of reeds on various perceptual indicators, such as timbre (bright-dark) and flexibility (flexible-resistant). The strength is correlated more or less to the stiffness of the reed considered as a spring. It is chosen by musicians as a function of the mouthpiece tip opening and can be adjusted using a knife to reduce the equivalent stiffness (which modifies the cut). In the simplest model of reed instruments, the reed mouthpiece system is a valve whose cross-section is modified by the reed as a function of the pressure drop (between the mouth and the mouthpiece), the lip force being usually ignored and considered as a constant. In this approach, the exciter (mouthpiece, reed, lip) is modeled by two parameters: the reed stiffness and the reed opening given for a specific lip force in the absence of mouth pressure. It has been demonstrated that the first parameter can be linked to the global feeling of ease of playing [3]. In the absence of lip force and mouth pressure, the opening at rest of the reed seems to be related to the intonation and reed strength, according to results obtained by Taillard [4] with a single clarinet player. These two parameters (stiffness, opening at rest) are not sufficient to predict the influence of the reed on other playing properties. So, there is a need of a more detailed characterization in order to estimate other parameters. However, the measurement of reed characteristics remains a difficult task.
First, reeds are complex systems which evolve during time as shown by Kemp [5]. Second, reeds show viscoelastic behavior [6]. Third, when reeds are played, they become more and more wet until they saturate. The amount of the water-soluble extractives decreases as shown by Obataya and Norimoto [7] and Bucur [8] so that the reeds characteristics are modified. At the end, the experimental characterization of reeds is a complex problem and compromises need to be done to set up a measurement method. Manufacturers choose to characterize them dry and before any use by the musician that could modify their mechanical or chemical properties.
Now, when characterizing a reed, different strategies can be chosen. Characterizing the material of the reed in terms of density, elastic properties and damping is one approach, but the link with the final product is far from being straightforward [9]. Another possibility is to measure reed vibrations properties on a specific test rig. This has been done by several authors such as Pinard et al. [10] and Stetson [11] who used optical holography to study the reed modes under acoustic excitation. They concluded that the existence and the symmetry of the first torsional mode may be an indicator of the reed quality (good or bad). However, Petiot et al. [12], when studying the perceived quality of 20 reeds with 10 saxophone players showed that the disagreement between the assessors for the descriptor “reed quality” is the highest among studied descriptors such as softness and brightness. As a matter of fact, it is difficult to conclude about reed global quality. Gazengel et al. [3] measured the static stiffness and the vibroacoustic response of 200 reeds. They shown that the static and dynamic compliance are related to the ease of playing but that it is difficult to make the link between physical measurements and other subjective descriptors. Finally, these results indicate that it is difficult to establish a strong correlation between physical parameters and musicians’ subjective assessments. This is probably due to the fact that the interaction between the reed and the mouthpiece is ignored.
Another technique is to measure the exciter. This can be done in quasi-static regime measuring the reed opening and the volume velocity entering the reed channel [4, 13, 14]. A goal of the various quasi-static regime studies is to compare the exciter’s nonlinear characteristic with some theoretical models. Most authors show that the crude model in which the reed behaves like a linear spring until the reed channel closes is valid in a large range [13, 14]. At the opposite, some authors propose models with more or less parameters to describe the nonlinear transition between bending and closing [4, 15].
In the literature, reed opening at zero pressure is usually considered as a fixed parameter (chapter 9 in the work of Chaigne and Kergomard [16]). This is somewhat artificial since the player modifies the reed channel opening by applying simultaneously a pressure in the mouth and a force on the reed with the lip. Then, it seems more relevant to consider the reed channel opening as a function of both lip force and pressure drop. However, in all these studies, lip force was not measured.
The purpose of this work is first to design a test rig that allows for the measurement of the effective jet cross-section as a function of both mouth pressure and lip force. The combined effect of lip force and pressure drop is represented as a “generalized pressure”, which is the sum of DC pressure drop and lip pressure. Lip pressure is defined as the ratio of lip force to an equivalent lip surface that can be calculated for a given lip geometry and lip displacement from the reed tip. At the end the test rig enables the measurement of the “generalized characteristic” of the reed which is the effective air jet cross-section represented as a function of the “generalized pressure”.
Second, the goal is to extract a few significant physical factors from the “generalized characteristics” in order to demonstrate differences between reeds of different types in terms of cut and strength (rated reed number).
Section 2 presents the physical model of the reed-lip-mouthpiece system and the concept of “generalized pressure”. Section 3 presents the experimental system. Section 4 explains how the characteristics of the mouthpiece with mounted reed are deduced from the physical measurements. It also shows how the equivalent lip area can be estimated from characteristics obtained for various lip forces leading to a single global characteristic. The parameters of the proposed model are also deduced from the global characteristics. In Section 5, the validity of the model is discussed by comparing the model and the measured characteristics. The robustness of the test rig is also assessed by estimating the repeatability of the equivalent parameters.
2 Models and generalized pressure
2.1 Usual model of the instrument
A single reed instrument consists of two basic parts: the mouthpiece with mounted reed and the instrument body. The body of the instrument completed by the mouthpiece volume is considered as the acoustic resonator. It can be characterized in the frequency domain by its input impedance  , where p represents pressure in the mouthpiece and Ur represents volume velocity at the resonator’s input. The set of reed, mouthpiece and lip is considered as the exciter. The volume velocity at the input of the exciter Uc, through the reed channel, is generally described by the Bernoulli equation
![Mathematical equation: $$ {U}_c(t)=S(t)\cdot \mathrm{sign}[\Delta p(t)]\cdot \sqrt{\frac{2|\Delta p(t)|}{\rho }}, $$](/articles/aacus/full_html/2025/01/aacus220063/aacus220063-eq2.gif) (1)
(1)
with S(t) the air jet effective cross-section, Δp(t) = Pm − p(t) the pressure drop between mouth and mouthpiece (Pm pressure in the mouth, p pressure in the mouthpiece) and ρ the air density considered as constant (see Fig. 1). This model assumes that the blowing pressure is varying slowly, that the pressure drop at the mouthpiece inlet is such that the flow separates from the wall at the end of the reed channel, forming a free jet into the mouthpiece as shown by Hirschberg et al. [17] and confirmed experimentally by Dalmont et al. [14].
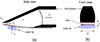 |
Figure 1 Diagram of the exciter and involved physical quantities. The red hatching represents the geometric opening section (different from S(t)) in the front (view (b)) and on the sides (view (a)). |
S(t) depends on both pressure drop Δp and lip force F and can also be influenced by lip and reed inertia and damping [15, 18]. It is usually written as S(t) = Sf(t), where Sf is the front section shown in Figure 1b in red hatching and defined by Sf = w · h(t) where w is the width of the reed and h(t) is the reed tip opening.
Usually models in literature consider a constant lip force F and express the effective cross-section S as a function of Δp only. Some of them, for example Colinot et al. [19], assume an affine relation S(Δp) for low values of Δp. In order to improve the model some authors introduce the effect of inertia and damping or take into account the collision of the reed on the mouthpiece [19, 20]. Some authors, as Van Walstijn and Avanzini [21], prefer to introduce a nonlinear function S(Δp) instead of considering the dynamic effects. Finally, Muñoz Arancón et al. [22] and Taillard [4] consider a nonlinear stiffness and keep damping and inertia values constant for modeling the reed behavior.
However the effective jet cross-section S(t) is different from the front section Sf. Indeed, air can enter through the lateral cross-section (shown in Fig. 1a in red hatching) as discussed e.g. by Yoshinaga et al. [23] or Taillard [4]. Also effective jet cross-section may differ from the front reed channel section because of vena contracta described by the contraction coefficient. This phenomenon has been numerically studied by Da Silva et al. [24] and experimentally by Dalmont et al. [14] using an optical measurement of the reed opening in parallel with an estimation of the volume velocity entering the resonator or by Lorenzini and Ragni [25] using Particle Image Velocimetry. Using experimental data gathered by Valkering [26], Chatziioannou [27] proposed a model to estimate the air-jet effective section S as a function of the front section Sf and side opening surfaces.
In the present study, S(t) is supposed to depend on both pressure drop Δp and lip force F. We assume a quasi static behavior of the reed which enables to neglect damping and inertial effects despite they may have indirectly a large influence on the spectrum.
2.2 Generalized mouth pressure
As previously stated, the player’s action is enabled by the mouth pressure Pm and the lip force F, which fluctuate much more slowly than the oscillations. The same reduction of the reed channel can be obtained by increasing the mouth pressure or the lip force. So it is reasonable to assume that both effects can be added so that a small variation ΔS of the air jet effective cross-section S can be written
 (2)
(2)
where ΔΔp is a small variation of the pressure, ΔF is a small variation of the lip force, C(S) = ∂S/∂Δp (m2Pa−1) is the aerostatic compliance, Cm(S) = ∂S/∂F (m2N−1) is the mechanical compliance. The ratio of these two quantities is a surface Ar(S) = C/Cm. Δpg is called the generalized pressure drop which takes into account the lip pressure  and is written Δpg = Δp + F/Ar. Note that we could as well have defined a generalized force Fg = ArΔp + F leading to Δs = CmΔFg.
Obviously, S(F) and S(Δp) can be nonlinear functions so that Ar is a priori not a constant and might depend on S. However, results obtained by Taillard [4] suggests that Ar can reasonably be considered independent of S. In that case, the function of two variables S = f(Δp, F) reduces to a function of only one variable S = g(Δpg). Ar can be found by rotating the space (Δp, F, S) around vertical axis (S axis) in order to get a single curve. An example of an experimental result is shown in Figure 2a which shows section S as a function of Δp and F. The same result is represented in Figure 2b after optimal rotation leading to the estimation of surface Ar as described in Section 4.4. In what follows, this hypothesis is discussed with regard to experiments. It should be noted that the surface Ar might be, if constant, an intrinsic characteristic of each reed.
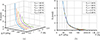 |
Figure 2 (a) Measured reed channel section S as a function of pressure drop Δp and lip force F. (b) Measured reed channel section S as a function of pressure drop Δp and lip force F after rotation around S axis (vertical axis). |
2.3 Nonlinear models of channel cross-section variations
Experiments reported in the literature show that when the reed is submitted to a small pressure difference Δp, the variation of the jet cross-section is a linear function of Δp [14], which enable to generalize as
 (3)
(3)
where S00 is the cross-section at rest i.e. without lip force or pressure and C is the aerostatic reed compliance for low Δpg. The theoretical closing pressure is then given by  .
.
For high values of the generalized pressure Δpg, the variation of the opening cross-section starts to be a nonlinear function of Δpg [21, 28].
Different models have been proposed in the literature [15, 22]. In these references, the model uses two parameters to model the bending of the reed on the mouthpiece rails.
In the present paper, we propose a simpler model which adds only one parameter for the non-linearity (half of the pressure interval on which the reed bending occurs), called elbow pressure Pe. The nonlinear part is modeled as a parabola centered on the theoretical closing pressure  . Writing
  , the relative jet section shown in Figure 3 is written
 (4)
(4)
with  . Notice that with this model, the first derivative of S(Δpg) is also continuous. Notice also that the actual “closing” pressure is PM + Pe.
 |
Figure 3 Theoretical nonlinear reed characteristic S(Δpg)/S00 (straight blue line). S00 is the opening cross-section at rest (without lip force), PM is the closing pressure. Red circles indicate the limits of the parabolic part which occurs between PM − Pe and PM + Pe. Blue dotted line indicate the linear part of the characteristics. In this example |

3 Materials
The experimental system is divided into two parts, the exciter (reed, mouthpiece, artificial lip) and the load. The load can be either a cylindrical duct as described by Muñoz Arancón et al. [29] or a diaphragm, as shown in Figure 4. As this system is designed in order to compare easily many reeds, the exciter is placed in open air and a negative pressure −Δp is created in the mouthpiece as proposed by Muñoz Arancón et al. [29]. The laboratory is the “mouth” in this experiment but we still define the “mouth pressure” as Pm = Patm − <p>, where Patm is the atmospheric pressure and <p> the mean pressure in the mouthpiece.
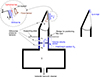 |
Figure 4 Experimental system used for measuring the exciter characteristics in quasi-static conditions. |
3.1 Exciter
The exciter comprises a Tenor saxophone mouthpiece (Vandoren TL5 optimum, tip opening 2.05 mm, table length 23 mm) clamped on a plate and connected to the load. The artificial lip is made of silicone rubber (CopsilGES-30, dimensions 30 mm × 10 mm × 10 mm) vacuum-molded. The lip is glued on a 3 mm cylindrical bar (see Fig. 4) playing the role of the musician’s teeth which, as observed experimentally, enables to reduce considerably the damping compared to the case where the lip is directly glued on a metallic plate. Moreover this enables the lip to rotate a little around the bar so that the lip angular position adapts better to the reed. The position of the lip is controlled by two axial micrometer screws in the frame (xL, yL) defined in the left of Figure 4 (see zoom). The origin of the lip is defined by positioning the edge of the lip at the top of the mouthpiece as shown on the right side of Figure 4. The uncertainty in the lip origin is estimated to be ±0.1 mm. The positioning of the reeds on the mouthpiece along xL axis is done with a mechanical wedge enabling to get a repeatable position relative to the mouthpiece tip. Finally a Vandoren optimum ligature is used in order to clamp the reed on the mouthpiece. The ligature position is defined by the line engraved on the mouthpiece and its position accuracy is estimated to be ±0.1 mm.
3.2 Load
Dynamic measurements
In this configuration, the exciter is connected to a cylindrical duct in order to produce self-sustained oscillations as described in the Figure 1 of Muñoz Arancón et al. [29]. The duct is connected to a volume V which is linked to a vacuum cleaner used to create the under pressure. The role of this volume is to impose a zero pressure value at the end of the resonator (duct) for the resonance frequencies of the instrument, uncoupling the impedance of the resonator and the aspirating source and reproducing free-field radiation. The pressure Pm is controlled thanks to a valve which enables to control manually the ratio of air aspirated from the up-stream part.
The total length of the resonator (duct + adaptation piece + mouthpiece) is 50 cm with a inner diameter of 16 mm. The diameter of the volume is 25 cm and its length is 25 cm in order to be tuned to the resonator equivalent length as discussed by Muñoz Arancón et al. [29]. Considering different lip positions xL and supply pressures Pm (controlled manually thanks to the valve), it is possible to produce self-sustained oscillations synchronized with the first mode of the resonator at a playing frequency around 172 Hz.
Quasi-static measurements
In the quasi static configuration, the exciter is connected to a diaphragm as shown in Figure 4. The diaphragm (diameter 3 mm):
increases the threshold pressure such that no oscillation appear as described in [14],
enables to estimate the volume velocity entering in the exciter thanks to a differential pressure sensor as described below,
is terminated by a volume V (12.3 L) which plays the role of a buffer volume increasing the constant time of the whole system.
3.3 Sensors
Description
Three differential pressure sensors Endevco 8507-C5 with a maximum pressure of 34474 Pa (5 PSI) are used. The sensor mounted in the mouthpiece enables to measure the differential pressure −Δp. The pressure sensors installed on either side of the diaphragm enable to measure the differential pressure ΔpU = p1 − p2. All sensors allow a measurement in static and dynamic conditions for a wide frequency range (<50 kHz according to the data-sheet). A force sensor Omega Engineering Inc. LCM703-5, maximum force 5 N is mounted between the artificial lip and the system supporting the lip.
Sensors are connected to a PicoScope® data acquisition board, which is controlled by the Python software. The sampling frequency used is 50 kHz for dynamic measurements and 1000 Hz for quasi-static measurements.
Calibration
The pressure sensor installed in the mouthpiece is calibrated using a U tube manometer filled with water. The uncertainty in the sensitivity is estimated to be ±0.3%. For quasi static measurements, the sensitivity of sensors placed in the flow sensor are estimated thanks to a relative calibration as follow: for each measurement, the calibration is performed when the reed is closed after creating a negative pressure in the whole system (mouthpiece + diaphragm + volume). In this case, the pressure is assumed to be identical for the three sensors (mouthpiece, sensors mounted apart from the diaphragm). This enables to deduce the sensitivities of two sensors mounted apart from the diaphragm knowing the sensitivity of the pressure sensor installed in the mouthpiece. The force sensor sensitivity is measured using different masses with an uncertainty of ±0.3%. Finally, the equivalent section of the diaphragm Sd is estimated by measuring the volume flow passing through the diaphragm during a given time thanks to a gas volume flow meter and by estimating the velocity thanks to the differential pressure ΔpU (Bernoulli equation). The uncertainty in the diaphragm diameter is estimated to be ±2%.
4 Measurement method
This section presents the measurement procedure of the generalized characteristics S(Δpg) and the estimation of the parameters of the model (Eq. (4)).
4.1 General principle
Once the reed is mounted on the mouthpiece with a given lip position (xL, yL), the different characteristics of the reed S(Δp) are estimated for different static lip force values F0 (obtained with different lip positions yL) in order to get the generalized characteristics. A minimum of two force values is required to estimate the generalized pressure. S(Δp) is deduced from S(t) using the pressure signals Δp(t) and ΔpU(t) as follow. The flow through the diaphragm is Ud = Sdvd where Sd is the effective cross-sectional area of the diaphragm estimated during calibration of the flow sensor (Sect. 3.3) and vd is the mean velocity of the fluid in the diaphragm estimated using Bernoulli’s equation. The flow rate through the diaphragm is therefore written as
![Mathematical equation: $$ {U}_{\mathrm{d}}(t)={S}_{\mathrm{d}}\cdot \mathrm{sign}[\Delta {p}_U(t)]\cdot \sqrt{\frac{2|\Delta {p}_U(t)|}{\rho }}, $$](/articles/aacus/full_html/2025/01/aacus220063/aacus220063-eq11.gif) (5)
(5)
where ρ is the air density. Since the flow through the diaphragm Ud is considered to be equal to the flow Uc entering the reed-table channel (incompressible fluid assumption), the jet section can be expressed as
 (6)
(6)
The relative uncertainty in the estimation of S(t) obtained thanks to the error propagation method can be written
![Mathematical equation: $$ \frac{{u}_S}{S}=\sqrt{{\left(\frac{{u}_{{S}_d}}{{S}_d}\right)}^2+\frac{1}{4}\left[{\left(\frac{{u}_{{pU}}}{|\Delta {p}_U(t)|}\right)}^2+{\left(\frac{{u}_p}{|\Delta p(t)|}\right)}^2\right]}, $$](/articles/aacus/full_html/2025/01/aacus220063/aacus220063-eq13.gif) (7)
(7)
with  the absolute uncertainty in the diaphragm area, upU and up the absolute uncertainties in ΔpU and Δp, respectively. Assuming that the additive noise on the pressure signals is Gaussian, the uncertainty up is written up = 2σp, where σp is the standard deviation of the pressure signal Δp(t). The uncertainty upU is given by upU = 2σpU, where σpU is the standard deviation of ΔpU(t).
The effective air-jet section S(t) is calculated when the condition  is verified, ermax being the maximum relative acceptable error. This means that S(t) is derived from pressure signals ΔpU(t) and ΔpU(t) for time segments that satisfy
 (8)
(8)
where the indicator I(t) presented in Figure 8 is written
 (9)
(9)
with  .
.
In order to reduce the variance in the pressure signals, especially  , the signals are low pass filtered using a cut-off frequency Fc = 5 Hz.
4.2 Assessment of the measurement accuracy
To examine the test rig’s effectiveness, a reference chamfered diaphragm replaces the mouthpiece-mounted reed mechanism (see Fig. 5). The reference diaphragm’s diameter is known (due to its manufacturing) and provides the reference section Sr.
 |
Figure 5 Experiment used in order to assess the performances of the test rig with a reference chamfered diaphram of diameter D. |
The experiment proceeds as follows: the acquisition begins and signals Δp(t), ΔpU(t) are measured. Upon activation of the vacuum cleaner, the reference diaphragm is sealed manually using a sealing paste. The valve linking the vacuum cleaner and the system is then closed, followed by stopping the vacuum cleaner. The reference diaphragm is reopened by manually removing the paste, leading to the equalization of pressures.
The experiment is then repeated with six reference diaphragms of varying diameters, each being measured ten times. Equation (6) estimates the effective jet section of each reference diaphragm based on observed signals picked in time slots defined by equation (9) with ermax = 5% and  .
.
Figure 6 depicts the effective jet section S estimated thanks to equation (6) for the six reference diaphragms (mean value of 10 measurements) as a function of the reference section Sr (known from manufacturing). These findings show that the technique can estimate the jet section with great repeatability and that this effective jet cross-section is smaller than the reference section for high section values (>10 mm2). Moreover, a leakage section has been estimated to be 0.2 mm2.
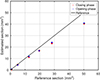 |
Figure 6 Effective jet sections S calculated thanks to equation (6) as a function of the reference sections Sr (known from manufacturing). |
Given that the greatest value of the estimated jet section in our observations is 10 mm2 (Fig. 9), the effective jet section can be realistically approximated using the test rig.
4.3 Measurement of reed characteristics
Given that the test rig can be utilized for calculating the effective jet section, the measurement of reed characteristics is accomplished in two major steps:
In a first step, the lip position xL is chosen in dynamic regime (with a cylindrical duct as a load) using the system described by Muñoz Arancón et al. [29].
In the second phase, the experimental device allowing quasi-static measurements (with a diaphragm as a load) is utilized (Fig. 4).
4.3.1 Choice of lip position xL
Before characterizing the reed using quasi-static measurements, it is necessary to choose lip coordinate xL that leads to realistic playing conditions. The experiment is made using a duct connected to the mouthpiece in order to produce self-sustained oscillations. For three supply pressure values Pm (≃26, 29, 33 hPa) and three lip positions xL (2, 3.5, 5 mm), the range of lip positions yL leading to self-sustained oscillations is sought. In all circumstances, the playing frequency (defined as the fundamental frequency of the oscillations) is expressed as a function of lip position yL.
The data reveals two key regions. For low values of yL that correspond to lax embouchure, the frequency remains constant and is typically 80 cents lower than the resonance frequency of the resonator specified in Section 3.2. The playing frequency increases with higher yL (medium to tight embouchure). In this scenario, the frequency ranges between −60 and 0 cents relative to the resonator’s resonance frequency.
The findings show that the playing frequency obtained with lax embouchure is significantly reliant on supply pressure, regardless of lip location xL. The results also show that the playing frequency is dependent on the supply pressure for xL = 2 mm and xL = 5 mm in medium and tight embouchures, respectively. However, at xL = 3.5 mm, the playing frequency is independent of supply pressure in medium and tight embouchures. Due to the small variability of the playing frequency as a function of Pm, the lip position for measurements is chosen to be xL = 3.5 mm. This choice is in agreement with the results obtained by Muñoz Arancón et al. [29] and Almeida et al. [13] but this value could be different using another lip with different dimensions as shown by Yoshinaga et al. [23] or Ukshini et al. [30].
4.3.2 Measurement of effective jet section
Once the lip position is determined (xL = 3.5 mm), the diaphragm replaces the cylindrical resonator. The experiment proceeds as follows: acquisition begins, and the vacuum cleaner is turned on until the reed channel is closed. The vacuum cleaner is turned off after closing the reed to allow the reed channel to open. The acquisition process is completed when the reed comes to rest. This method estimates the effective section S twice, utilizing the reed’s opening and closing stages. This experiment is done for different lip positions yL corresponding to different forces at rest F0. The link between yL and F0 is shown in Appendix.
Figure 7 displays an example featuring a diaphragm pressure drop ΔpU(t) for 5 different lip forces at rest F0 (associated with 5 distinct lip positions yL). Figure 7 shows that the pressure drop across the diaphragm, ΔpU(t), is dependent on F0. When F0 values are small, the rate of change in ΔpU(t) is high, resulting in a very brief reed opening time. Conversely, when forces are high, the reed fails to open, making it impossible to determine the effective area S.
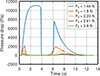 |
Figure 7 Pressure drop signal in the flow sensor ΔpU(t) for different lip forces at rest F0. |
To estimate reed properties using the approach outlined in Section 4.4, the measurement should be done in a quasi-static situation, and the reed’s dynamic effects must be negligible. As previously established, a low lip force F0 leads the reed to open quickly, with significant dynamic effects. In contrast, a significant lip force F0 causes a relatively small pressure drop across the diaphragm, making determining the equivalent jet section impossible due to noise.
To evaluate the reed properties S(Δpg), the least lip force  and maximum lip force
  need to be determined experimentally. To accomplish this, the operator monitors the time signal ΔpU(t) for each reed and lip position yL. Based on this information, the operator judges whether the lip force is too high or too low. The signal ΔpU(t) in the first scenario has a high temporal derivative, which is indicative of a rapid opening and a high maximum value. In the latter instance, a low maximum value and a low SNR (signal to noise ratio) are indicated by the signal ΔpU(t), which also exhibits a low time derivative.
Finally, the effective section is determined when equation (8) is respected, which conducts the usage of the time signals Δp(t) and ΔpU(t) for certain time slots. Figure 8 illustrates the indicator derived from equation (9). In this example, the closing phase lasts t ∈ [2.2–2.9] seconds, while the opening phase lasts t ∈ [8.1–11.4] seconds, indicating that the closing phase lasts longer than the opening phase.
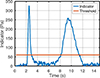 |
Figure 8 Indicator obtained thanks to equation (8). The minimum value of the indicator (threshold) is given as the straight horizontal line. |
4.4 Estimation of reed equivalent parameters
To get the generalized characteristics S(Δpg) for each reed, the measurement described in the previous section is repeated for various lip force F0, and the effective sections (corresponding to different lip force levels) are determined using equation (6).
From the different quantities S(t), F(t), it is possible to get the 3D plot (Δp, F, S) as shown on Figure 2a. This characteristic is similar to results obtained by Taillard [4] showing a linear behavior for low values of Δp, then a curvature due to the bending of the reed on the mouthpiece lay.
The effect of lip position yL (static lip force F0) can be clearly observed. When the force increases, the jet section decreases for Δp = 0. Using the reed characteristics S(Δp, F) (Fig. 2a), it is possible to deduce the generalized characteristics S(Δpg) using a rotation around the S axis as described in Section 2.2. This rotation is done in two steps. In the first step, a principal component analysis (PCA) is used to estimate a rough value of reed equivalent surface  defined in equation (2). In a second phase, a best estimate of Ar is obtained by fitting a polynomial model with order 10 to the experimental data S(Δpg) and seeking for the smallest fitting error.
Following the optimal rotation, a Levenberg-Marquardt nonlinear regression (function leasqr of GNU Octave [31]) is applied using the function defined in equation (4). The error characterizing the quality of the model is defined by
 (10)
(10)
where Sκ(m) is the mth value of the modeled opening section, and S(m) is the mth value of the effective opening section estimated from measurements (Eq. (6)).
Figure 9 shows an example of final optimization. The left graph depicts the characteristics in the pressure range selected using equation (8), whereas the right graph depicts them over the entire pressure range.
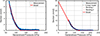 |
Figure 9 Example of generalized characteristics. Left: experimental (blue star) and theoretical (red straight line) characteristics in the measured pressure range. Right: experimental (blue star) and theoretical (red straight line) characteristics in the full pressure range. |
5 Results
In this section, tests are conducted using the approach outlined in Section 4. The accuracy of the test rig is estimated and the performance of the model provided in Section 2.3 is evaluated. Twenty four tenor saxophone reeds have been used, as described in Table 1. Note that the strength of reed with different material and cut can not be compared (e.g. Cane Classic 3 reeds and Cane Jazz 3 reeds are not equivalent according to manufacturers [2]). Measured reeds are all new and have never been used. The measurement conditions are the same as those used by manufacturers to categorize dried reeds. This is the most reasonable solution and the one we chose because otherwise the degree of humidification of a reed is uncontrollable.
The eight types of reeds measured in this experiment with their associated names.
The hygrometry rate ranged from 45% to 55% during the measurement. Each reed was removed and remounted five times, with measurements recorded each time. For each measurement, five lip positions yL leading to five lip forces F0 are employed to estimate the generalized characteristics. The measurement duration for each lip position is nearly 1 minute, resulting in a total measurement time of 5 minutes for 1 repetition. Once completed, each reed underwent a 25 closing and opening process, resulting in a total measuring time of 25 minutes per reed.
5.1 Measurement variability and robustness of the model identification method
The impact of performing the measurement 5 times is examined. The mean quadratic error e (Eq. (10)) over reed measurements is 4% when the reed opens and 7% when it closes. This demonstrates that the measurement is more robust when measuring the reed during the opening phase, because the opening is slower (Fig. 8) and better respects the hypothesis of a quasi-static behavior. For this reason, it is decided to keep only the measurements during the opening phase. For each measurement, a model identification is done. An ANOVA computed with Jamovi [32] suggests that the effect of repetition is not significant (p-value > 0.05) except for one reed (the American synthetic reed). For this reed, S00 is somewhat greater (almost 10%) for the initial occurrence than for the subsequent repetitions. This suggests for this particular reed a “breaking” effect, i.e., that the reed opening at rest gradually decreases for a reed under repeated effort [14, 33]. Finally, it can be concluded that measurements and parameters evaluation are reproducible, particularly for cane reeds.
The robustness of the model identification can be seen on Figures 10 (cane reeds) and 11 (synthetic reeds) which illustrates that cane reeds have the lowest error e, while synthetic reeds show a larger deviation with the model. Error e is on average 7% for cane reeds, while it is 9% and 13% for american and classic synthetic reeds respectively. It appears that the three parameters model is more compatible with cane reeds than with synthetic reeds which reveals a different behavior for the latter.
 |
Figure 10 Left: cane reed classic cut strength 3, estimation error e = 4.5%. Right: cane reed jazz cut strength 3.5, estimation error e = 7.1% |
 |
Figure 11 Left: synthetic reed american cut strength 2.25, estimation error e = 9.9%. Right: synthetic reed classic cut strength 2.5, estimation error e = 13.3%. |
5.2 Effect of reed type
Results show that the equivalent reed area Ar is depending on the reed type (p-value < 0.01). It is 3.37 cm2 for classic cane reed (±1.5%), while it is 3.08 cm2 for jazz cane reed (±1%). On the other hand, it is 2.9 cm2 for classic synthetic reed (±3%), while it is 2.94 cm2 for American synthetic reed (±1.4%). The effect of strength is not significant on Ar as well as on the extrapolated cross-section at rest S00 excepted for classic cane reeds as can be seen in Figure 12. On the contrary, S00 is significantly dependent on the reed type. It is interesting to notice that for cane reeds, S00 is 30% higher for the jazz cut than for the classic cut, while it has been verified with a camera that the opening at rest (without lip) is the same. They also have significantly different elbow pressure Pe values, as shown in Figure 13. Finally, it appears from Figure 14 that classical and jazz cane reeds have similar closing pressures PM and, as it could be awaited, PM is slightly related to the reed strength, except for synthetic american reeds (p-value = 0.33). American Synthetic have a much lower PM value. However, the effect of PM on the reed type is highly significant (p-value < 0.01). To summarize, it can be said that various reed types lead to different behavior which can be emphasized by a less good match with the model (for the synthetic reeds) and different Ar, S00, PM and Pe values. Especially, it is observed that jazz cane reeds have higher S00 and lower Pe than classic cane reeds.
 |
Figure 12 Extrapolated cross-section at rest S00 for different reed types (material, cut, strength). |
 |
Figure 13 Elbow pressure Pe for different reed types (material, cut, strength). |
 |
Figure 14 Closing pressure PM for different reed types (material, cut, strength). |
5.3 Effect of reed
The aim of the test rig is not only to emphasize the differences between different reed types but also to emphasize differences between reeds of the same type. The study focused here on classic cane reeds shows that Ar seems to depend on the reeds. However, the difference remains small, Ar is almost the same in a box (Fig. 15). The effective opening at rest is different for some reeds. For example, Figure 15 shows that reed no. 4 (among the Cc2.5 reed type) differs from the other reeds in this box.
 |
Figure 15 Ar and S00 for 10 classical cane reeds of strength 2.5 and 3. |
Figure 16 shows PM and Pe for 10 classic cut cane reeds with strength 2.5 and 3. This shows that parameters PM and Pe make it possible to distinguish between several cane reeds in a single box. It seems that the dispersion in a given box is quite large so that reeds of lower strength can have a higher PM value than some reeds of higher strength.
 |
Figure 16 PM and Pe for 10 classical cane reeds of strength 2.5 and 3. |
6 Conclusion
The test rig presented in this work is shown to be effective for the characterization of simple reeds in the quasi-static regime (slow opening of the reed). It enables to estimate the characteristic nonlinear relation between the jet cross-section and the pressure drop through the reed channel. Moreover, introducing the generalized pressure Δpg, the sum of air pressure and lip “pressure”, it is possible to estimate a unique characteristic. This result confirms those obtained by Taillard [4] and complete them since the force was still not measured. Lip “pressure” is defined as the force exerted by the lip on the reed divided by an equivalent area Ar which is determined for each reed. In order to reduce the information to a limited number of parameters, this characteristic is modeled using a 3-piece-wise function involving only three parameters: the extrapolated opening at rest S00, the closing pressure PM and the elbow pressure Pe which gives the extent of the parabolic part between the two linear parts of the characteristic. At the end of the identification process each reed is characterized by five parameters, the equivalent area, the reed opening at rest, the closing pressure, the elbow pressure and an error term e evaluating the model consistency. First results on cane and synthetic reeds show that the model better fit with cane reeds than with synthetic reeds. So this parameter might be an important information on the quality of the reed. First results also suggest that the equivalent area Ar depend on the type of the reed but is the same for reeds of the same type. Other parameters may depend on reed type as well as, in a smaller extent, on the reed. The test rig will be used to test a larger number of reeds and see how these characteristics can be correlated with musicians’ subjective assessments. On this point of view, it must be kept in mind that some reed properties such as inertia and damping which may be of some importance for the musicians are not considered in our experiment.
Acknowledgments
Authors thank Hervé Mezière, Eric Egon and Jacky Maroudaye for technical assistance in design and building of the experiment. Authors are grateful to Christophe Vergez for his careful reading of the paper and wise suggestions.
Conflicts of interest
The authors declare that they have no conflicts of interest.
Data availability statement
Data are available on request from the authors
Appendix
Link between lip position and lip force
The link between lip position yL and lip force at rest F0 (given for Δp = 0) is determined by observing the relation between lip force F(t), mouth pressure Δp(t) for different lip positions yL as shown on Figure A1. This figure shows that air pressure relaxes the contact force of the lip on the reed. Indeed, when pressure increases, lip force diminishes. For low pressure values, the force variation is almost proportional to pressure. For higher pressure values (typically 4000 Pa in Fig. A1), the lip force is not proportional to pressure any more. The force varies less, most likely due to the reed tip bending on the mouthpiece. These results allow us to determine the force at rest F0 that corresponds to the lip location yL for Δp = 0. This force at rest is calculated using order 3 least mean square regression.
 |
Figure A1 Lip force F as a function of pressure Δp for different lip positions yL. |
References
- Légère Reeds. Available at https://www.legere.com/products/saxophone-reeds/. [Google Scholar]
- Vandoren Reeds. Available at https://vandoren.fr/en/reeds-technical-elements/. [Google Scholar]
- B. Gazengel, J.-P. Dalmont, J.-F. Petiot: Link between objective and subjective characterizations of Bb clarinet reeds. Applied Acoustics 106 (2016) 155–166. [CrossRef] [Google Scholar]
- P.-A. Taillard: Theoretical and experimental study of the role of the reed in clarinet playing. PhD thesis, 2018, Le Mans Université. [Google Scholar]
- C. Kemp, G. Scavone: Mechanical, anatomical and modeling techniques for alto saxophone reed evaluation and classification. Wood Science and Technology 54 (2020) 1677–1704. [CrossRef] [Google Scholar]
- P.-A. Taillard, F. Laloë, M. Gross, J.-P. Dalmont, J. Kergomard: Statistical estimation of mechanical parameters of clarinet reeds using experimental and numerical approaches. Acta Acustica united with Acustica 100, 3 (2014) 555–573. [CrossRef] [Google Scholar]
- E. Obataya, M. Norimoto: Acoustic properties of a reed (Arundo donax L.) used for the vibrating plate of a clarinet. Journal of the Acoustical Society of America 106, 2 (1999) 1106–1110. [CrossRef] [Google Scholar]
- V. Bucur: Traditional and new materials for the reeds of woodwind musical instruments. Wood Science and Technology 53, 5 (2019) 1157–1187. [CrossRef] [Google Scholar]
- D.J. Casadonte: The clarinet reed: an introduction to its biology, chemistry, and physics. PhD thesis, 1995, The Ohio State University. [Google Scholar]
- F. Pinard, B. Laine, H. Vach: Musical quality assessment of clarinet reeds using optical holography. Journal of the Acoustical Society of America 113, 3 (2003) 1736–1742. [CrossRef] [PubMed] [Google Scholar]
- K. Stetson: Study of clarinet reeds using digital holography. Optical Engineering 53, 11 (2014) 112305. [CrossRef] [Google Scholar]
- J.-F. Petiot, P. Kersaudy, G. Scavone, S. McAdams, B. Gazengel: Investigation of the relationships between perceived qualities and sound parameters of saxophone reeds. Acta Acustica united with Acustica 103, 5 (2017) 812–829. [CrossRef] [Google Scholar]
- A. Almeida, C. Vergez, R. Caussé: Quasistatic nonlinear characteristics of double-reed instruments. Journal of the Acoustical Society of America 121, 1 (2007) 536–546. [CrossRef] [PubMed] [Google Scholar]
- J.-P. Dalmont, J. Gilbert, S. Ollivier: Nonlinear characteristics of single-reed instruments: quasistatic volume flow and reed opening measurements. Journal of the Acoustical Society of America 114, 4 (2003) 2253–2262. [CrossRef] [PubMed] [Google Scholar]
- V. Chatziioannou, M. Van Walstijn: Estimation of clarinet reed parameters by inverse modelling. Acta Acustica united with Acustica 98, 4 (2012) 629–639. [CrossRef] [Google Scholar]
- A. Chaigne, J. Kergomard: Acoustics of musical instruments, Springer, New York, NY, 2016. [CrossRef] [Google Scholar]
- A. Hirschberg, R.W.A. Van de Laar, J.P. Marrou-Maurieres, A.P.J. Wijnands, H.J. Dane, S.G. Kruijswijk, A.J.M. Houtsma: A quasi-stationary model of air flow in the reed channel of single-reed woodwind instruments. Acta Acustica united with Acustica 70, 2 (1990) 146–154. [Google Scholar]
- A. Gaillard, V. Koehl, B. Gazengel: Theoretical and experimental studies about single cane reeds: a review. Acta Acustica 8 (2024) 63. [CrossRef] [EDP Sciences] [Google Scholar]
- T. Colinot, L. Guillot, C. Vergez, P. Guillemain, J.-B. Doc, B. Cochelin: Influence of the “ghost reed” simplification on the bifurcation diagram of a saxophone model. Acta Acustica united with Acustica 105, 6 (2019) 1291–1294. [CrossRef] [Google Scholar]
- S. Bilbao, A. Torin, V. Chatziioannou: Numerical modeling of collisions in musical instruments. Acta Acustica united with Acustica 101, 1 (2015) 155–173. [CrossRef] [Google Scholar]
- M. Van Walstijn, F. Avanzini: Modelling the mechanical response of the reed-mouthpiece-lip system of a clarinet. Part II: A lumped model approximation. Acta Acustica united with Acustica 93, 3 (2007) 435–446. [Google Scholar]
- A. Muñoz Arancón, B. Gazengel, J.-P. Dalmont, E. Conan: Estimation of saxophone reed parameters during playing. Journal of the Acoustical Society of America 139, 5 (2016) 2754–2765. [CrossRef] [PubMed] [Google Scholar]
- T. Yoshinaga, H. Yokoyama, T. Shoji, A. Miki, A. Iida: Global numerical simulation of fluid-structure-acoustic interaction in a single-reed instrument. Journal of the Acoustical Society of America 149, 3 (2021) 1623–1632. [CrossRef] [PubMed] [Google Scholar]
- A. Ricardo da Silva, G.P. Scavone, M. van Walstijn: Numerical simulations of fluid-structure interactions in single-reed mouthpieces. Journal of the Acoustical Society of America 122, 3 (2007) 1798–1809. [CrossRef] [PubMed] [Google Scholar]
- V. Lorenzoni, D. Ragni: Experimental investigation of the flow inside a saxophone mouthpiece by particle image velocimetry. Journal of the Acoustical Society of America 131, 1 (2012) 715–721. [CrossRef] [PubMed] [Google Scholar]
- A.M.C. Valkering: Characterization of a clarinet mouthpiece. Technical Report R-1219-S, Vakgroep Transportfysica – Eindhoven University of Technology, 1993. [Google Scholar]
- V. Chatziioannou: Forward and inverse modelling of single-reed woodwind instruments with applications to digital sound synthesis. PhD thesis, Queen’s University Belfast, 2010. [Google Scholar]
- F. Avanzini, M. Van Walstijn: Modelling the mechanical response of the reed-mouthpiece-lip system of a clarinet. Part I. A one-dimensional distributed model. Acta Acustica united with Acustica 90, 3 (2004) 537–547. [Google Scholar]
- A.M. Arancón, B. Gazengel, J.P. Dalmont: Comparison of human and artificial playing of a single reed instrument. Acta Acustica united with Acustica 104, 6 (2018) 1104–1117. [CrossRef] [Google Scholar]
- E. Ukshini, J.J.J. Dirckx: Influence of lip position, lip force and blowing pressure on the tuning and playability of an alto saxophone mouthpiece. Applied Acoustics 199 (2022) 109011. [CrossRef] [Google Scholar]
- J.W. Eaton, D. Bateman, S. Hauberg, R. Wehbring: GNU Octave version 8.4.0 manual: a high-level interactive language for numerical computations, 2023. Available at https://www.gnu.org/software/octave/doc/v8.4.0/. [Google Scholar]
- M. Şahin, E. Aybek: Jamovi: an easy to use statistical software for the social scientists. International Journal of Assessment Tools in Education 6, 4 (2019) 670–692. [Google Scholar]
- E. Marandas, V. Gibiat, C. Besnainou, N. Grand: Caractérisation mécanique des anches simples d’instruments à vent. Le Journal de Physique IV 4, C5 (1994) C5–633. [Google Scholar]
Cite this article as: Gazengel B. Dalmont JP. Gaillard A. Brasseur E. & Taillard P-A. 2025. Characterization of single reed mouthpiece interaction in quasi static regime. Acta Acustica, 9, 5. https://doi.org/10.1051/aacus/2024082.
All Tables
The eight types of reeds measured in this experiment with their associated names.
All Figures
|
Figure 1 Diagram of the exciter and involved physical quantities. The red hatching represents the geometric opening section (different from S(t)) in the front (view (b)) and on the sides (view (a)). |
| In the text | |
|
Figure 2 (a) Measured reed channel section S as a function of pressure drop Δp and lip force F. (b) Measured reed channel section S as a function of pressure drop Δp and lip force F after rotation around S axis (vertical axis). |
| In the text | |
|
Figure 3 Theoretical nonlinear reed characteristic S(Δpg)/S00 (straight blue line). S00 is the opening cross-section at rest (without lip force), PM is the closing pressure. Red circles indicate the limits of the parabolic part which occurs between PM − Pe and PM + Pe. Blue dotted line indicate the linear part of the characteristics. In this example |
| In the text | |
|
Figure 4 Experimental system used for measuring the exciter characteristics in quasi-static conditions. |
| In the text | |
|
Figure 5 Experiment used in order to assess the performances of the test rig with a reference chamfered diaphram of diameter D. |
| In the text | |
|
Figure 6 Effective jet sections S calculated thanks to equation (6) as a function of the reference sections Sr (known from manufacturing). |
| In the text | |
|
Figure 7 Pressure drop signal in the flow sensor ΔpU(t) for different lip forces at rest F0. |
| In the text | |
|
Figure 8 Indicator obtained thanks to equation (8). The minimum value of the indicator (threshold) is given as the straight horizontal line. |
| In the text | |
|
Figure 9 Example of generalized characteristics. Left: experimental (blue star) and theoretical (red straight line) characteristics in the measured pressure range. Right: experimental (blue star) and theoretical (red straight line) characteristics in the full pressure range. |
| In the text | |
|
Figure 10 Left: cane reed classic cut strength 3, estimation error e = 4.5%. Right: cane reed jazz cut strength 3.5, estimation error e = 7.1% |
| In the text | |
|
Figure 11 Left: synthetic reed american cut strength 2.25, estimation error e = 9.9%. Right: synthetic reed classic cut strength 2.5, estimation error e = 13.3%. |
| In the text | |
|
Figure 12 Extrapolated cross-section at rest S00 for different reed types (material, cut, strength). |
| In the text | |
|
Figure 13 Elbow pressure Pe for different reed types (material, cut, strength). |
| In the text | |
|
Figure 14 Closing pressure PM for different reed types (material, cut, strength). |
| In the text | |
|
Figure 15 Ar and S00 for 10 classical cane reeds of strength 2.5 and 3. |
| In the text | |
|
Figure 16 PM and Pe for 10 classical cane reeds of strength 2.5 and 3. |
| In the text | |
|
Figure A1 Lip force F as a function of pressure Δp for different lip positions yL. |
| In the text | |
Current usage metrics show cumulative count of Article Views (full-text article views including HTML views, PDF and ePub downloads, according to the available data) and Abstracts Views on Vision4Press platform.
Data correspond to usage on the plateform after 2015. The current usage metrics is available 48-96 hours after online publication and is updated daily on week days.
Initial download of the metrics may take a while.