Figure 2
Download original image
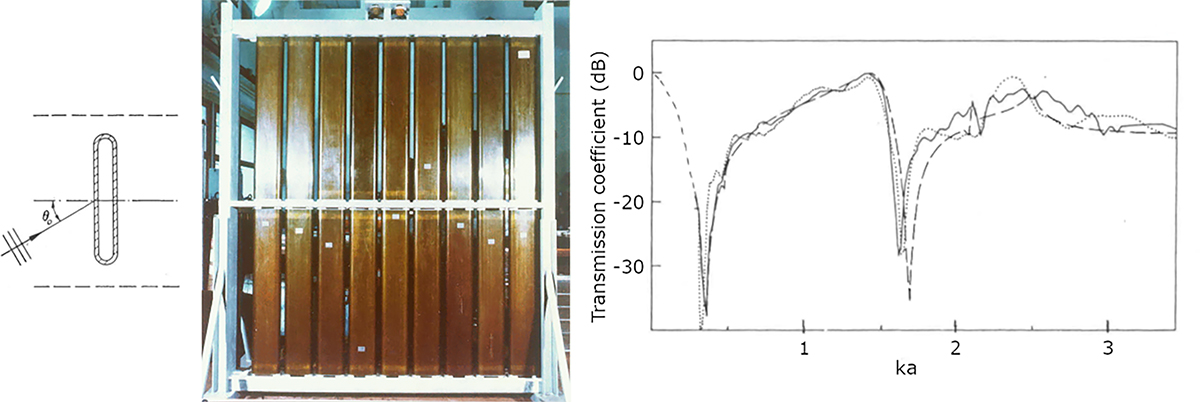
Left: section of unit cell of a compliant tube array. Center: photograph of a panel based on such an array. Right: transmission spectra obtained from numerical simulations (dashed line), measured with a large-area hydrophone (dotted line), and averaged over an array of 11 hydrophones (solid line). The horizontal axis is a normalized frequency, with k being the wavenumber in water and a the array period (adapted from [21]).
Current usage metrics show cumulative count of Article Views (full-text article views including HTML views, PDF and ePub downloads, according to the available data) and Abstracts Views on Vision4Press platform.
Data correspond to usage on the plateform after 2015. The current usage metrics is available 48-96 hours after online publication and is updated daily on week days.
Initial download of the metrics may take a while.