Figure 6
Download original image
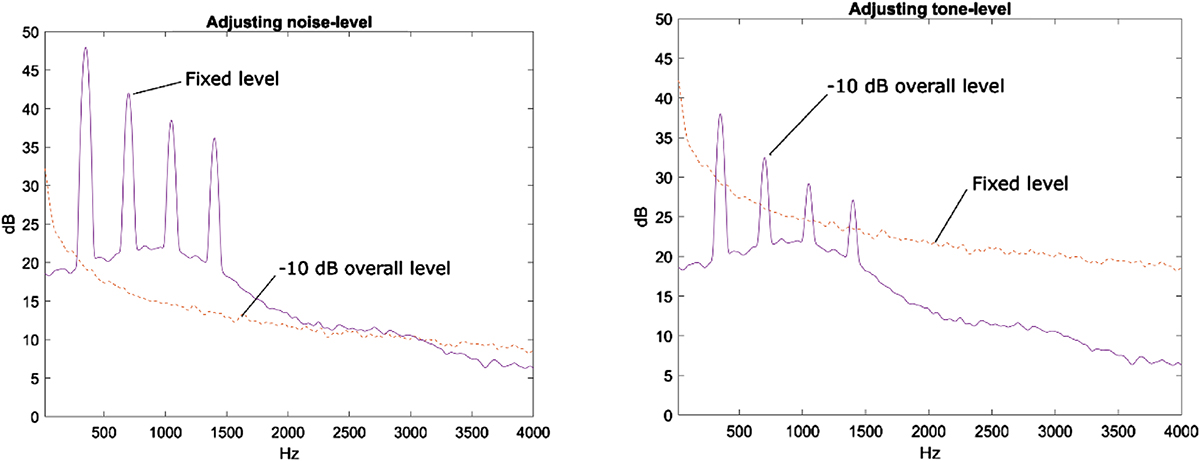
The figure presents the relation of the sound stimuli at the start of the different listening tests. Left: method A – The initial level of the fixed stationary complex four-partial tonal sound with 350 Hz fundamental frequency mixed with background noise (solid), and the adjustable pink noise (dashed). Right: method B – The initial level of the adjustable complex four-partial tonal sound with 350 Hz fundamental frequency mixed with the constant background noise (solid), and the stationary pink noise (dashed).
Current usage metrics show cumulative count of Article Views (full-text article views including HTML views, PDF and ePub downloads, according to the available data) and Abstracts Views on Vision4Press platform.
Data correspond to usage on the plateform after 2015. The current usage metrics is available 48-96 hours after online publication and is updated daily on week days.
Initial download of the metrics may take a while.