Figure 10

Download original image
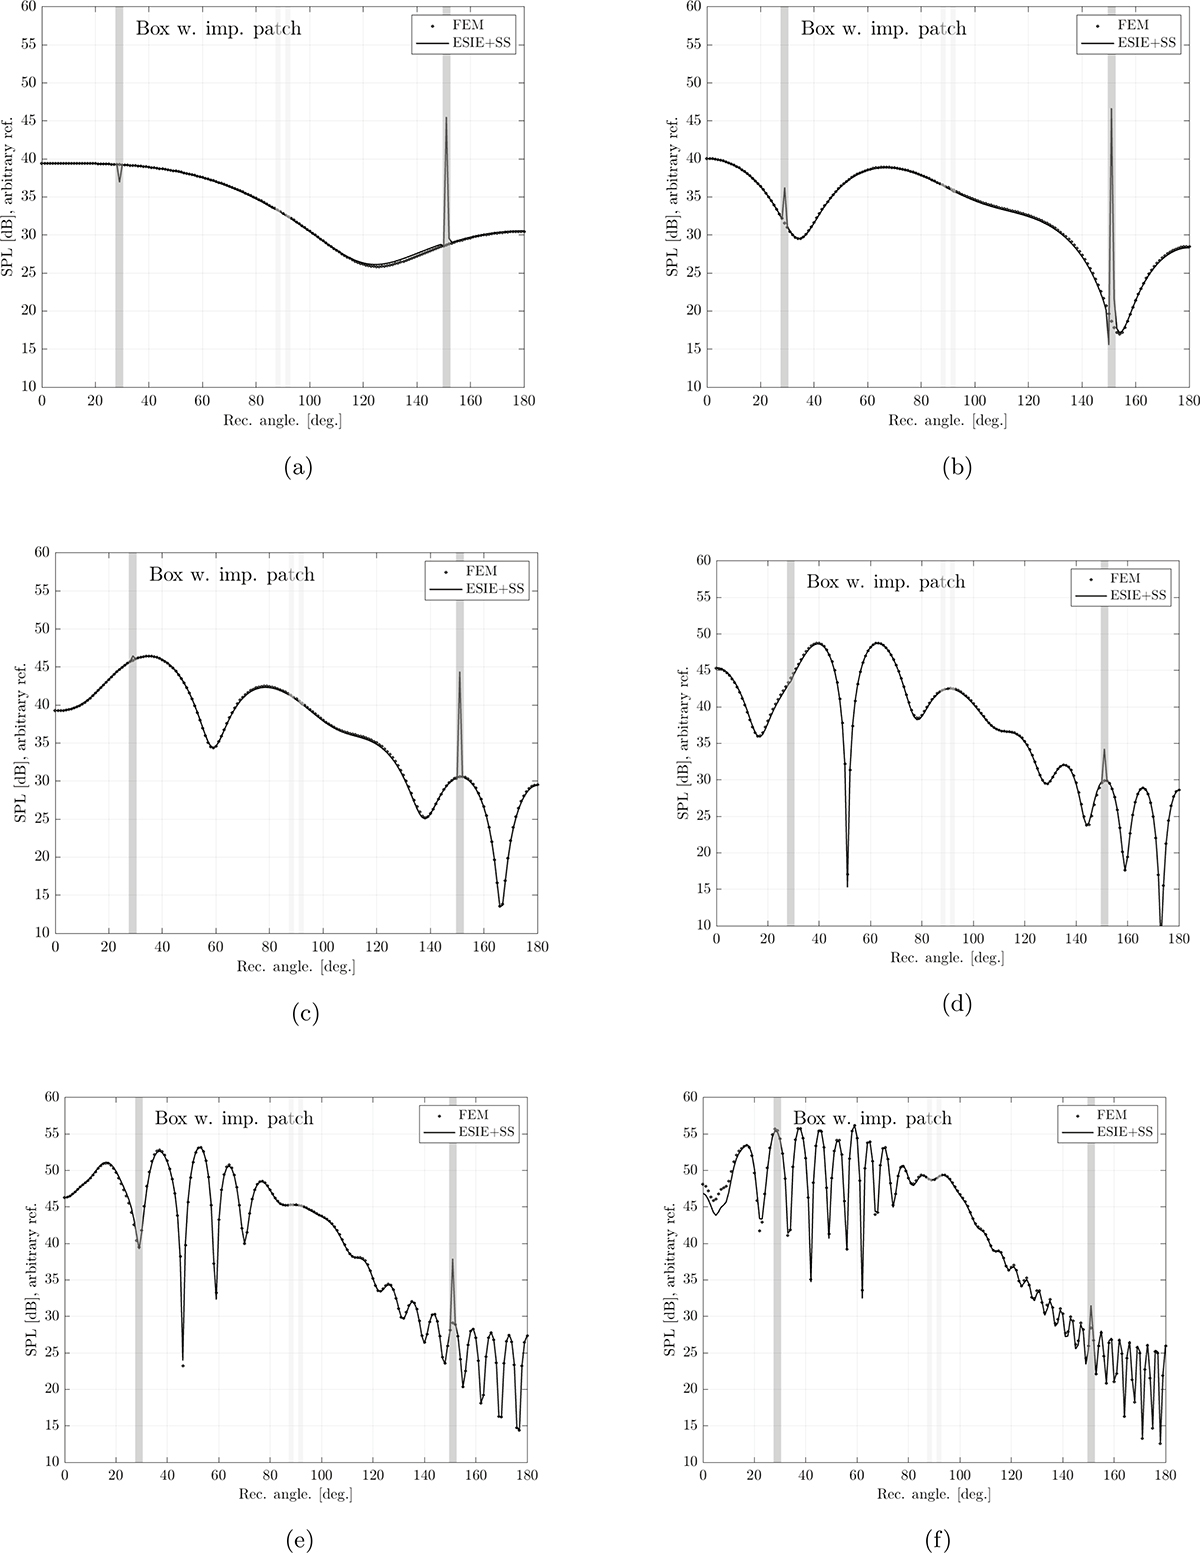
Median-quantile-values for the calculation error for (a) the all-rigid box, calculated with the ESIE method only, and (b) the box with an impedance patch, calculated with the ESIE+SS method. In both diagrams, the quantile values are given for 18 frequencies, including those not shown in Figures 9 and 11. The median and quantile values were based on the 181 receiver angle values shown in Figures 9 and 11. In (c) results for all frequencies and all 181 receiver positions were pooled into one dataset. Note the different scale in (c).
Current usage metrics show cumulative count of Article Views (full-text article views including HTML views, PDF and ePub downloads, according to the available data) and Abstracts Views on Vision4Press platform.
Data correspond to usage on the plateform after 2015. The current usage metrics is available 48-96 hours after online publication and is updated daily on week days.
Initial download of the metrics may take a while.


