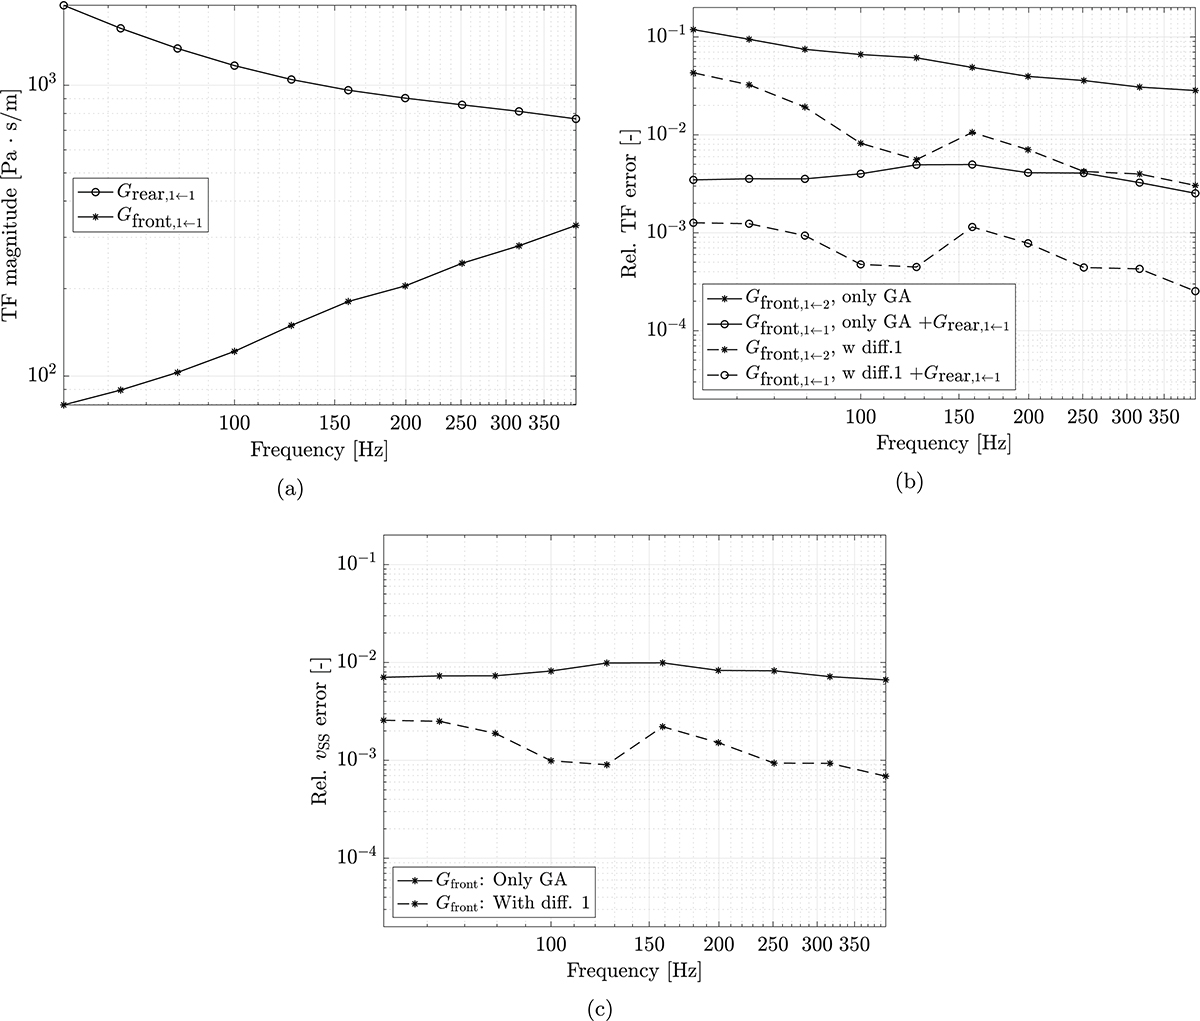
Figure 14
Download original image
For the numerical example in Figures 7–13, in the frequency range which used two secondary sources: (a) The transfer function magnitudes Gfront and Grear for the SS 1← SS 1 combination. (b) The relative error for the G = Gfront + Grear transfer functions, when either only GA, or GA+first-order diffraction is included. (c) The relative error for the vSS secondary source amplitudes (due to symmetry both secondary sources get the same amplitude).
Current usage metrics show cumulative count of Article Views (full-text article views including HTML views, PDF and ePub downloads, according to the available data) and Abstracts Views on Vision4Press platform.
Data correspond to usage on the plateform after 2015. The current usage metrics is available 48-96 hours after online publication and is updated daily on week days.
Initial download of the metrics may take a while.