Figure 2
Download original image
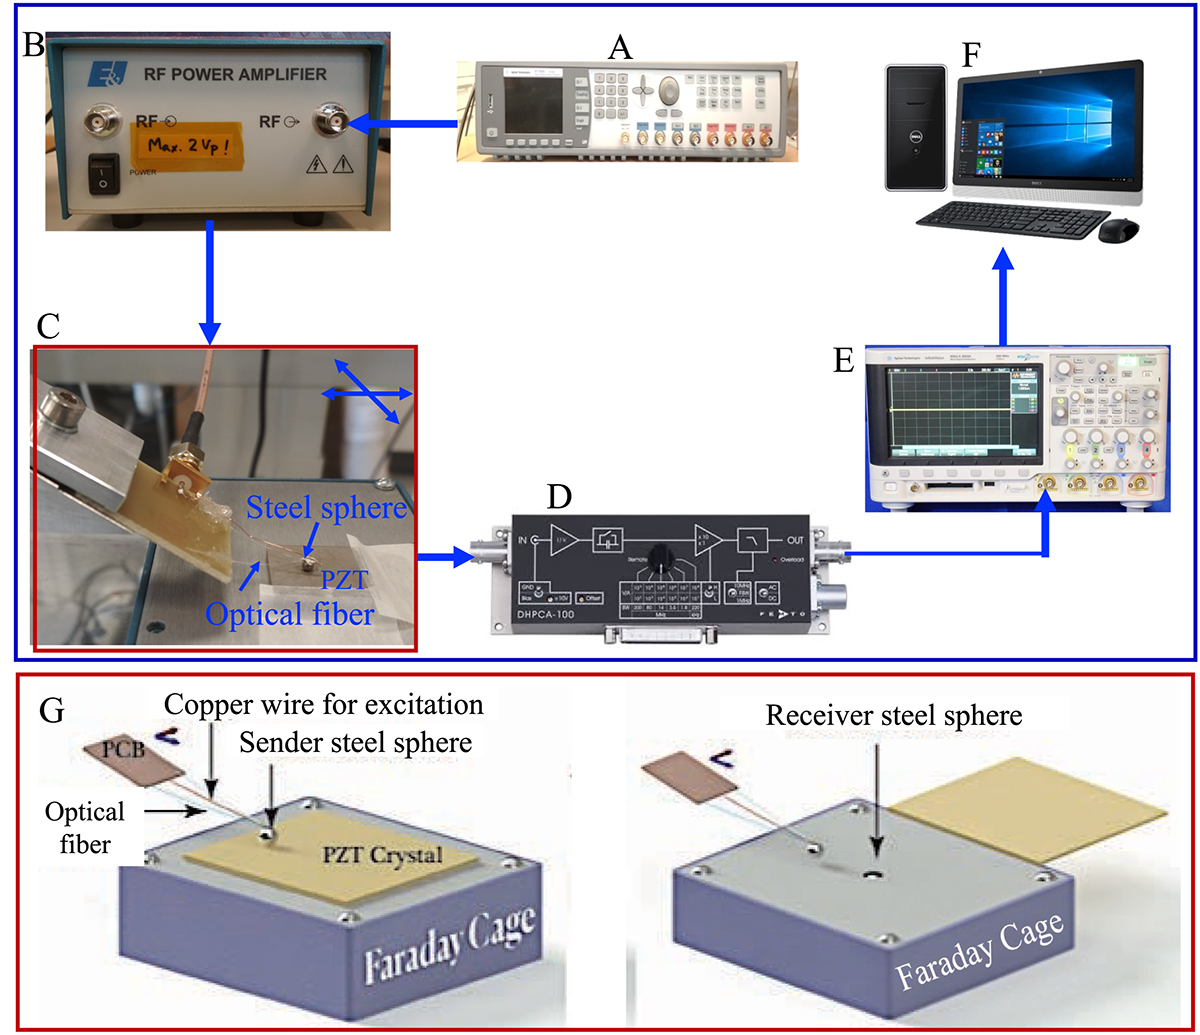
Schematic diagram illustrating the experimental setup for point contact excitation and detection. Signal generation (Block A) amplifies the signal (Block B), exciting the acoustic waves in the Coulomb probe configuration (Block C). The trans-impedance conversion (Block D) directs signals to the oscilloscope (Block E) for averaging and digitization. Subsequently, data is transferred via USB to a PC (Block F). Block G represents the probe and sample placement setup within the Faraday cage, while block C (highlighted with a red rectangle) schematically corresponds to block G, illustrating the sender and receiver probes. The image acquisition area was 10 mm × 10 mm, with a step size of 50 μm in both directions.
Current usage metrics show cumulative count of Article Views (full-text article views including HTML views, PDF and ePub downloads, according to the available data) and Abstracts Views on Vision4Press platform.
Data correspond to usage on the plateform after 2015. The current usage metrics is available 48-96 hours after online publication and is updated daily on week days.
Initial download of the metrics may take a while.