| Issue |
Acta Acust.
Volume 9, 2025
|
|
|---|---|---|
| Article Number | 14 | |
| Number of page(s) | 15 | |
| Section | Building Acoustics | |
| DOI | https://doi.org/10.1051/aacus/2025001 | |
| Published online | 19 February 2025 | |
Scientific Article
The influence of the restitution coefficient and multiple impacts on the force exerted by ISO tapping machines
Physikalisch-Technische Bundesanstalt, Braunschweig, Germany
* Corresponding author: This email address is being protected from spambots. You need JavaScript enabled to view it.
Received:
18
September
2024
Accepted:
3
January
2025
Abstract
ISO tapping machines serve as absolute standards to describe the sensitivity of buildings and building elements in terms of impact noise. They consist of five hammers with a mass of 500 g each. The hammers strike the test object at a velocity corresponding to a free fall from a height of 4 cm with a time interval of 0.1 s between subsequent impacts. The force exerted by ISO tapping machines depends on the interaction between source and receiver. This interaction is governed by two independent phenomena: the mobility (mis)match and the restitution coefficient, i.e. the ratio of the hammer velocity after and before the impact. It is theoretically between 0 and 1 which introduces an uncertainty range of ±3 dB for the level of the interacting force. This contribution extends the existing equation for the blocked force of ISO tapping machines to cover multiple impacts since their occurrence is related to the force and the restitution coefficient. It is then shown experimentally that the restitution coefficient can cover the full theoretical range in practical situations. Fortunately, different types of tapping machines exhibit nearly the same restitution coefficient on the same receiver, and no systematic influence of the restitution coefficient on the hammer velocity before the impact or on the time intervals between impacts is observed. A first attempt to predict the restitution coefficient based on the mobility match between source and receiver did not give satisfactory results. A prediction of the restitution coefficient thus remains an open question.
Key words: ISO tapping machine / Force / Restitution coefficient / Multiple impacts
© The Author(s), Published by EDP Sciences, 2025
 This is an Open Access article distributed under the terms of the Creative Commons Attribution License (https://creativecommons.org/licenses/by/4.0), which permits unrestricted use, distribution, and reproduction in any medium, provided the original work is properly cited.
1 Introduction
ISO tapping machines are structure-borne sound sources which provide a standardised excitation of horizontal building elements. The resulting sound pressure level in a receiving room, which is normalised with respect to the receiving room’s acoustic properties, is the major quantity to characterise impact noise. This normalised or standardised impact sound pressure level is applicable to whole buildings or single building elements. ISO tapping machines are thus an inevitable part of the definition of the main descriptors for impact noise. In the context of impact noise measurements but also predictions, ISO tapping machines are absolute standards. Their properties and also how to verify them are therefore precisely defined in international standards, e.g. ISO 10140-5 [1].
For the following analysis, ISO tapping machines are considered to be structure-borne sound sources in the sense of EN 15657 [2]. Such a source can be characterised by three quantities, a single equivalent blocked force, a single equivalent free velocity and a single equivalent source mobility. Two of these quantities are sufficient to describe the source completely since the third quantity can always be calculated from the other two quantities. The mentioned source quantities can be used to predict the interaction of the source with a receiver where the latter is characterised by its single equivalent mobility. The force acting on the receiver and also the power transmitted from the source to the receiver depend on the combination between source and receiverproperties.
The single equivalent blocked force is chosen as the major source descriptor for this contribution. It is the force that would occur when the tapping machine is operated on a receiver which is immobile. This is technically equivalent to the situation that the point mobility of the receiver is much lower than the source mobility. The source mobility of tapping machines can easily be estimated from the mass of its hammers and needs no further consideration in the course of this contribution.
A basic advantage of using the source description of EN 15657 [2] is that the properties of the source and of the receiver are clearly separated. Unfortunately, this is not completely applicable to ISO tapping machines. When the hammers are released, they impact the tested floor with a certain hammer velocity. After the impact, the hammers rebound with a new velocity. The transmitted momentum depends on the hammer mass and on the hammer velocities immediately before and after the impact. The ratio between the hammer velocities after and before the impact is the restitution coefficient. The hammer velocity after the impact can theoretically be between zero and the value before the impact. The blocked force level for these two extreme cases therefore differs by 6 dB. Since the rebound effect depends on the combination of source and receiver properties, the blocked force level also depends on this combination. It is to be emphasised here that this interaction between source and receiver causing a certain restitution coefficient is independent from the source-receiver interaction due to their mobilities. Even in a blocked force condition, the restitution coefficient can assume all values between 0 and 1.
The magnitude of the rebound effect is not known in a real situation. Therefore, a mean rebound effect is usually considered which gives a mean blocked force level for ISO tapping machines. The actual blocked force level in a real situation is then within a span of ±3 dB of that mean blocked force level. Since this span is quite large in view of the uncertainties for impact noise given in ISO 12999-1 [3], this contribution attempts to gain more insight into the influence of the restitution coefficient. The main questions are:
-
Which restitution coefficients are observed in practice?
-
Is the restitution coefficient identical for different types of tapping machines?
-
Does the restitution coefficient influence the other quantities that determine the blocked force, i.e. the hammer velocity before impact and the mean time between hammer impacts?
-
Can the restitution coefficient be predicted?
Starting point for the investigation is the existing equation how the blocked force of a tapping machine depends on the restitution coefficient. Then, this equation is modified to include the effect of multiple impacts since their occurrence turned out to be related to the restitution coefficient. Subsequently, the results of an extensive measurement program are presented where the restitution coefficient is measured on a special test plate for several types of tapping machines. This test plate enables a simultaneous measurement of the hammer velocities before and after impact and the exerted force. Further on, measured restitution coefficients on different floorings are shown, also for different tapping machines. It is then investigated whether the restitution coefficient can be predicted for practical applications before the paper is finally concluded.
2 Relation between blocked force and restitution coefficient for single and multiple impacts
2.1 Single impacts
The level of the blocked force in one-third octave bands is calculated from (see e.g. [4])
![Mathematical equation: $$ \begin{aligned}&L_{F,\mathrm{b} ,1} \nonumber \\&=20\,\lg \;\mathopen \mathclose {\left[ {\frac{m\;v_{\mathrm{max} } \mathopen \mathclose {\left( {1+k} \right)}}{\;F_{0} } \sqrt{\frac{2\;\mathopen \mathclose {\left( {10^{1/20}-10^{-1/20}} \right)} f\;}{T}}}\right]}\,\mathrm{dB} . \end{aligned} $$](/articles/aacus/full_html/2025/01/aacus240110/aacus240110-eq1.gif) (1)
(1)
Here, m is the hammer mass, v max is the hammer velocity before the impact, T is the mean time between hammer impacts, f is the midband frequency of the respective one-third octave band, k is the restitution coefficient, i.e. the ratio between hammer velocities immediately after and before the impact, and the reference force is
 (2)
(2)
Equation (1) describes the situation when each hammer impacts the ground only once within one cycle. This or similar equations can be found in numerous places e.g. [5–8]. Very often, equations involve the impulse I which is given by
 (3)
(3)
Whereas [5] presents the equation for the assumption of k = 0, Brunskog et al. [6] addresses the full range. Cremeret al. [7] describes an average situation by the energetic mean value between the case of no rebound and full rebound, i.e. k = 0.41. This case also proved to be representative in [4]. In his PhD-thesis, Buhlert uses k = 1 for an ISO-tapping machine on a concrete slab [8]. So, existing equations cover the full theoretical range of the restitution coefficient.
There are several measurements of the force exerted by ISO-tapping machines reported. They are either performed by reciprocity (e.g. [8]) or directly by using a force sensor as a receiver (e.g. [9]) or by integrating the force sensor into a hammer of a tapping machine (e.g. [10]) or by applying a reception plate (e.g. [4]). All existing measurement results clearly confirm the validity of equation (1). An explicit investigation of the force on wooden floors yielded restitution coefficients between 0 and 0.6 [10]. In [11], a restitution coefficient of 0.8 is proposed for concrete slabs whereas the range of 0.3 to 0.6 is recommended for soft floor coverings.
2.2 Multiple impacts
When the hammer impacts the receiver it bounces back to a certain height. Then it falls down again and a second impact occurs. This process then continues until the hammer is at rest. The multiple impacts increase the force and thus the sound power transmitted to the receiver. When n-fold impacts occur, the level of the blocked force is simply the energetic sum of the n pulses
![Mathematical equation: $$ \begin{aligned} L_{F,\mathrm{b} } =10\,\lg \;\mathopen \mathclose {\left[ { \sum _{i=1}^{n} 10^{0,1 L_{F,\mathrm{bl} ,i} /\mathrm{dB} }} \right]}\,\mathrm{dB} \end{aligned} $$](/articles/aacus/full_html/2025/01/aacus240110/aacus240110-eq4.gif) (4)
(4)
when the time duration and thus the phase relation between the pulses are considered to be sufficiently random over the measurement time which is reasonably used for impact noise measurements. Due to the variations observed in ISO-tapping machines [12] this seems to be justified. Under the further assumption that the restitution coefficient is constant for all hammers and all successive impacts, the level of the blocked force can be calculated by expressing the blocked force level of the i-th impact according to equation (1) and inserting this into equation (4). It turns out to be
![Mathematical equation: $$ \begin{aligned} L_{F,\mathrm{b} }&=L_{F,\mathrm{b} ,1} +10\,\lg \mathopen \mathclose {\left[1+k^{2}+k^{4}+\cdots \right]}\,\mathrm{dB} \nonumber \\&=L_{F,\mathrm{b} ,1} +10\,\lg \mathopen \mathclose {\left[\sum _{i=1}^{n} k^{2\mathopen \mathclose {\left( {i-1} \right)}}\right]}\,\mathrm{dB} . \end{aligned} $$](/articles/aacus/full_html/2025/01/aacus240110/aacus240110-eq5.gif) (5)
(5)
For a frictionless hammer fall from a height of h = 40 mm it can be calculated that a second impact is avoided when the restitution coefficient fulfills the condition (see Appendix A)
 (6)
(6)
where g is the gravitational acceleration and t lift is the time between the first impact and the lift of the hammer. Likewise, a third hammer impact is avoided for
 (7)
(7)
ISO 10140-5 [1] requires that the time between hammer impact and lift of the hammer has to be smaller than 80 ms. For the course of this contribution, the interpretation of this requirement is that the hammer would be lifted at the latest after 80 ms if no rebound would occur. When a rebound occurs the time when the hammer is caught in flight is different from t lift depending on the implementation of this requirement.
Using the requirement t lift = 80 ms from ISO 10140-5 [1], double impacts are avoided for k > 0.44 and triple impacts for k > 0.33. Figure 1 shows the increase of the blocked force level
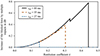 |
Figure 1 Increase of the level of the blocked force of an ISO tapping machine due to double and triple impacts according to equation (8) for different times between first hammer impact and hammer lift t lift. |
![Mathematical equation: $$ \begin{aligned} \mathrm{\Delta }L_{F,\mathrm{b} }&=L_{F,\mathrm{b} } -L_{F,\mathrm{b} ,1}\nonumber \\&={\mathopen \mathclose {\left\{ \begin{array}{ll} 10\,\lg \mathopen \mathclose {\left[ {1+k^{2}+k^{4}} \right]}\,\mathrm{dB}&\text{ for} k<k_{1} \\ 10\,\lg \mathopen \mathclose {\left[ {1+k^{2}} \right]}\,\mathrm{dB}&\text{ for} k_{1} < k < k_{2} \\ 0\,\mathrm{dB}&\text{ for} k>k_{2}\\ \end{array}\right.}} \end{aligned} $$](/articles/aacus/full_html/2025/01/aacus240110/aacus240110-eq8.gif) (8)
(8)
as a function of the restitution coefficient due to double and triple impacts for different times t lift between first impact and lift of the hammer. It can be seen that the ISO requirement restricts the force level increase to values below 0.8 dB. This is the maximum value of the graph for t lift = 80 ms in Figure 1 rounded to one decimal digit. The sudden drops observed in Figure 1 are caused by k crossing the region between one and two impacts or between two and three impacts (see Eq. (8)). This occurs at different k for different t lift. When t lift is smaller than the ISO requirement, the force level increase is smaller than 0.8 dB. The force level shows no increase at all when t lift is zero, i.e. when multiple impacts are fully suppressed by an immediate lift of the hammer. Figure 1 also shows that it is not necessary to consider the fourth and further impacts because their contribution to the energetic sum of the blocked force level is negligible.
The above equations are also applicable to calculate the theoretical change of the level of an ISO tapping machine with the falling height of the hammers under the assumption of no friction. For a constant number of impacts (one, two or three in the current calculation model), the blocked force level changes with the hammer falling height with a rate of 0.11 dB/mm (Fig. 2). This is the case for the displayed examples of a restitution coefficient of 0.46 and 0.42. The curve for a restitution coefficient of 0.42 is about 0.8 dB larger because double impacts occur for all displayed hammer falling heights, see also equation (8). When the restitution coefficient is 0.44, double impacts occur for falling heights up to about 40.5 mm whereas double impacts are avoided for larger falling heights. This leads to the observed sudden drop of the increase of the blocked force level.
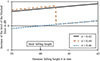 |
Figure 2 Increase of the level of the blocked force of an ISO tapping machine according to equation (8) as a function of the falling height of the hammer for a fixed time between hammer impact and hammer lift of t lift = 80 ms and different restitution coefficients. |
3 Measurements
3.1 Measurement of the hammer velocity before and after impact
The planned experiments require a measurement of the hammer velocity before and after impact. For this, the hammer velocity signal is measured with a laser vibrometer which is pointing from the top on the hammer shaft. A similar setup has already been introduced in [12]. A typical section of the time signal for a single hammer impact is shown in Figure 3.
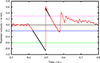 |
Figure 3 Velocity-signal of a single hammer impact (red) with threshold values (pink, blue, green) and the linear interpolations (black) before and after the impact. |
The hammer is released (at t ≈ 0.4 s) and then falls free – minus the remaining friction in the guide. The jump at the impact (at t ≈ 0.5 s) is clearly visible. After the impact, the hammer rings and the velocity decreases again according to a free fall – starting from a positive initial value. The hammer is finally caught (at t ≈ 0.575 s) by the mechanism of the tapping machine. The algorithm must reliably identify an impact from such a typical course of the velocity signal.
The analysis starts by checking if the velocity signal drops below a given first threshold (currently at −0.2 m/s, the blue line in Fig. 3) and stays below this value, until it crosses a second threshold (currently at −0.6 m/s, the green line in Fig. 3), and finally rises above the first threshold again. By this double threshold-criterion, events like the capture of the hammer, that cross the first (blue) threshold but not the second (green), are ignored as impact events.
Starting with a valid impact event, the location is sought where 0 m/s is crossed in the rising slope of the signal. From there, the last minimum before and the first maximum after the zero-crossing are sought using floating averages and simple slope-change detection.
The velocity signal may still include usual noise and especially spikes from signal losses inside the vibrometer. This can spoil the results. Therefore, spikes are masked out where the slope of adjacent samples deviates significantly from the standard gravitational acceleration of −9.81 m/s2. Then the minimum value of the velocity before the impact can be identified. This is the measurement value of the hammer right before the impact. And it shall be checked against the requirements of the standards.
To get an average value for the acceleration before the impact and to get an impression of the friction between the falling hammer and its guide, a linear interpolation is performed for the signal before the identified impact (the first black line in Fig. 3), starting at the first threshold line (blue). This completes the analysis before the impact.
A linear interpolation is also the first analysis step after the impact (the second black line in Fig. 3). It starts at the first maximum after the zero-crossing and stops at a given third threshold (currently at +0.3 m/s, the pink line in Fig. 3).
Trying to include a damped oscillation of the ringing hammer into this fit often fails because of fluctuations and undulations in the signal. The linear interpolation stays insensitive against eventual oscillations of whatever amplitude. Adding a low-pass-filter to dampen the oscillation is no good solution as this would deform the signal of the sharp impact.
As oscillations from the ringing hammer sometimes already occur in the rising slope of the signal during the impact, it was found useful to add a relaxation to the linear fit. The maximum value of this extended fit is taken as the requested velocity value of the rebound. The result is shown in Figure 4.
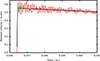 |
Figure 4 Velocity-signal of a part of a single hammer impact (red) with the approximation (black) and the maximum value of this approximation (green). |
When all valid impact events of the velocity signal are analysed, an average duration of a cycle of the tapping machine can be calculated. This must take into account that, for whatever reasons, not all impacts may have been identified as valid in the velocity signal. These gaps must be detected and skipped. Then 1/5 of this cycle time is the average time between two hammer impacts T (see Eq. (1)).
3.2 Measurements on a test plate
To measure the blocked force directly, a receiving plate with built-in force transducers was conceived. The receiving plate must have a significantly lower mobility than the hammer of the tapping machine. The 20 mm thick brass plate shown in Figure 5 was chosen. For the measurements, it was lying on the laboratory floor. A flat layer of plastic foam material with a thickness of about 5 mm was used as an underlay to compensate for the unevenness of the floor. The brass plate has five threaded holes for mounting the force transducers. Since only one suitable force transducer was available at the time of the measurements, steel dummies were used for the positions where no measurements were taken. Since the force transducer is screwed onto the brass plate and is not embedded flush, a level adjustment for the tapping machines is required. This was achieved using aluminium compensating pieces adapted to the types of tapping machines available at PTB. Thanks to their special shape the compensating pieces also prevent the tapping machines from drifting out of position, which would otherwise often occur. Figure 6 shows the receiving plate with four different types of tapping machines in position.
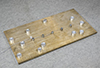 |
Figure 5 Receiving plate with force sensor. |
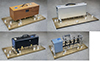 |
Figure 6 Different types of tapping machines positioned on the receiving plate. |
The mobility of the receiving plate was measured at the five reception points, without force sensor or steel dummies mounted. The measured mobility (Fig. 7) is close to the theoretical value of the infinite plate of 4 ⋅ 10−5 m/(Ns) which corresponds to a mobility level of −18 dB re 0.0025 (m/s)/N. The scatter between the different measurement points is due to the modal behaviour of the brass plate. The mobility of a hammer with a mass of 500 g is also shown in Figure 7. The mobility of the brass plate is thus sufficiently low to enable a measurement of the blocked force up to about 500 Hz. Figure 7 also includes the mobility of the force sensor calculated from its stiffness of 5 ⋅ 10−10 m/N. This number is provided by the manufacturer of the sensor. It can be seen clearly that the sensor stiffness results in a very low sensor mobility which does not influence the measured blocked force levels.
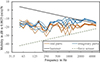 |
Figure 7 Measured mobilities at the five force transducer positions (real parts and imaginary parts) and the mobility of a tapping machine hammer and of the force sensor. |
Six tapping machines (TM) of four different types were used for the measurements. For each tapping machine, the impact force of each of the five hammers was measured over a period of 50 s with a sampling rate of 96 kHz. The velocity of the respective hammer was recorded simultaneously using a laser vibrometer. Each measurement was repeated three times, with the tapping machine being lifted and replaced in between. The one-third octave band levels LF, bl, meas of the measured force were calculated from the force signal using FFT with 4M = 222 samples, corresponding to 43.7 s averaging time. The recorded velocity signal provides between 95 and 99 evaluable hammer impacts in the time window of 50 s, from which the mean hammer velocities before and after impact and the mean time between hammer impacts were determined as described in Section 3.1. The one-third octave values LF, bl, calc of the theoretically expected blocked force can therefore be calculated for each measurement according to equation (1) and compared with the measured force levels. Figure 8 shows a sketch of the experimental setup.
Figure 9 shows a typical course of the calculated and measured blocked force, as observed in a similar form for all types of tapping machines. Measured and calculated force run in parallel over a wide frequency range with an offset of approx. 0.5 dB. Above 1 kHz, the measured force drops because the required mobility mismatch, i.e. that the hammer mobility must be much larger than the receiver mobility, is no longer given (see Fig. 7). The irregular course at frequencies below 160 Hz cannot fully be explained yet. Both the natural resonances of the receiving plate (including tilting modes) and the spectral structure of the force signal could play a role here. Repeating a measurement by lifting and re-installing a tapping machine did not bring about a significant change.
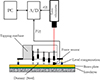 |
Figure 8 Experimental setup for the measurement of the blocked force. |
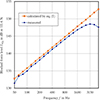 |
Figure 9 Typical course of calculated and measured force level. |
For further evaluation, the measured and calculated one-third octave values of the force levels from 100 Hz to 500 Hz were arithmetically averaged. This also makes sense considering that the occurence of multiple impacts cannot be specified as a function of frequency. Figure 10 shows the difference between directly measured and calculated force levels for all measurements, with each measuring point representing the average of ≥95 hammer blows.
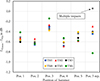 |
Figure 10 Summary of the difference between directly measured and calculated blocked force. |
The differences show the offset of 0.5 dB on average, which is also visible in Figure 9. The results for the individual tapping machines are mostly located close together. The measurement at hammer position 3 was somewhat noticeable and was repeated, which, however, raised other questions. The high value for tapping machine 5 can be explained by multiple impacts that did not occur before; although these contribute to the measured force, they do not contribute to the calculated value according to equation (1). No conclusive explanation could be found for the now low value of tapping machine 6 at hammer position 3. Overall, however, it can be said that the measurement setup is well suited for determining the blocked force of standard tapping machines.
The described setup enables a thorough investigation of the influence of multiple impacts as analysed in Section 2.2. Two measurement series were conducted for this purpose. First, the falling height of one tapping machine (TM1) was varied between 30 mm and 40 mm, and both the force and the velocity profile were measured and evaluated for one hammer position. The measured and calculated blocked forces are shown in Figure 11 with respect to the measured impact speed. The calculated blocked forces are given here for each individual hammer blow. The red line shows the minimum value for the impact velocity required by the measurement standards [1]. The line drawn in black shows the theoretical course of the blocked force for a restitution coefficient of k = 0.44 and the 500 Hz one-third octave band.
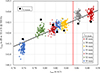 |
Figure 11 Change in the measured L F, bl, meas and calculated L F, bl, calc blocked force when varying the falling height, tapping machine 1, hammer 3. |
Between 40 mm and 35 mm falling height, the measured blocked force has an offset of −0.3 dB to the values calculated by equation (1), which is in good agreement with the earlier measurements. With further reduction of the falling height, this offset becomes positive, because multiple impacts set in, which are not considered for the calculated blocked force.
In a second approach the falling height of all employed tapping machines was varied from 30 mm to 44 mm. Here, only the time-averaged one-third octave band spectrum of the blocked force was measured with a force transducer at hammer position 3. The averaging time was set to 30 s. Figure 12 shows the difference of the measured blocked force level at a respective falling height to the measured blocked force level at a falling height of 41 mm. The blocked force level is averaged over the one-third octave bands from 100 Hz to 500 Hz.
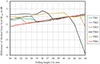 |
Figure 12 Difference of the measured blocked force level to the blocked force level at 41 mm falling height. Average values of blocked force level from 100 Hz to 500 Hz. |
With decreasing falling height, the onset of multiple impacts is indicated by a sudden increase of the blocked force. For TM1 and TM2 this occurs at a falling height of 34 mm, for TM3 at 32 mm, for TM4 at 37 mm and for TM5 at 40 mm. Different tapping machines show a different behaviour because the time between hammer impact and hammer lift varies for different tapping machines, but also the restitution coefficient may be different. Only TM6 does not display any multiple impacts. This is achieved by the electro-mechanical operation, which allows for a very short time between the impact and the lift of the hammer, which cannot be realised in a purely mechanical way. The result displayed in Figure 12 is thus an experimental proof of the theoretical findings from Section 2.2 for falling heights below 41 mm. For larger falling heights, TM3 and TM4 show decreasing force levels, i.e. the force is too small. This is in contradiction to the requirement from [1] that the hammers must fall at least 4 mm below the supporting plane. This observation is not considered any further in the context of this contribution.
3.3 Measurements on different floorings
The experimental setup used for the measurements on different floorings also makes use of the laser vibrometer as shown in Figure 8. Since the force sensor could not be used there was no level compensation applied. An additional accelerometer was always mounted on the receiving structure to detect the time intervals between the hammer impacts. The laser vibrometer was again used to measure impact velocities and restitution coefficients of the individual hammers. The recording time for each measurement was 7 s, providing 12 to 13 evaluable hammer impacts. All presented results are averaged over all hammer impacts within the measurement duration.
In total, six tapping machines (TM), of four different types were employed, TM1–TM5 are mechanical devices, while TM6 is electro-mechanic. In a first series of measurements, five tapping machines were operated on six different floorings, tapping machine number six was not available at this time. Further investigations were made with two tapping machines (TM1 and TM6) on a concrete block, which was measured unmodified and with four different linings. The floorings used in the first series of measurements are described in Table 1. The setups used for the second series (concrete block + linings) are described in Table 2. The only aspect in the selection of the floorings was to cover a wide range between soft and hard impacts. The ratio between source and receiver mobility had therefore to be accepted as it was. Occuring mobilities are shown in Figure 13.
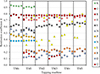 |
Figure 13 Absolute value of all measured receiver mobilities. The red line indicates the mobility of a typical hammer mass (500 g). |
Floorings used in the first series of measurements (TM1–TM5 employed).
Setup of measurements on concrete block (TM1 and TM6 employed, except setup “Q”.)
Figure 14 shows an overview of all measured restitution coefficients. The theoretically possible range for the restitution coefficient between 0 and 1 is almost entirely covered by the different measurement setups. There is no or little significant variation of the restitution coefficient between the individual tapping machines. For the laminate flooring “L”, the restitution coefficient shows a huge variation between the hammer positions. This can be explained by the inhomogeneous structure of this setup. Certain repeating patterns can also be observed for some other setups, but these are less pronounced.
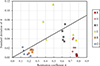 |
Figure 14 Overview of all measured restitution coefficients for different floorings. |
It is of interest to investigate the variation of the restitution coefficient between individual tapping machines. For this purpose, the average value and the standard deviation of the restitution coefficient between tapping machines was calculated for the floorings listed in Table 1, where five tapping machines were used. The calculation was done individually for each hammer position. The result is shown in Figure 15. There is no clear relation between the standard deviation of k and k itself. Nevertheless, a reasonable upper limit for this standard deviation of 0.1k may be deduced from Figure 15.
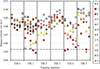 |
Figure 15 Average restitution coefficient and related standard deviations for different tapping machines. The black line is 0.1k. |
An overview of the measured impact velocities is given in Figure 16. Of the 205 measured impact velocities, only four are slightly below 0.853 m/s, which is the minimum permitted value by ISO 10140-5 [1] if a mass tolerance of the hammer of ±6 grams is kept. The upper permitted value of 0.919 m/s is never exceeded. TM1, which was used for all measurements, received servicing after the first part of the tests (cleaning and lubrication), and afterwards delivered higher impact velocities. TM3 and TM6, which are more recent types, seem to show less sensitivity towards different receiving structures.
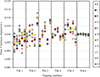 |
Figure 16 Overview of all measured impact velocities. |
Figure 17 displays all measured time intervals between consecutive hammer impacts. As could be expected, TM6, which works electro-mechanical, shows very little variation of impact times. Here, a 10 Hz spectrum is more likely to be expected. All other tapping machines show larger variations.
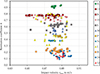 |
Figure 17 Overview of all measured time intervals between impacts. |
It is also of interest to investigate the relation between restitution coefficient and impact velocity or time intervals. This is displayed in Figures 18 and 19 respectively. It has been assumed that, at least for certain types of tapping machines, the restitution coefficient may have an influence on the impact velocity. A high restitution coefficient can create a strong impact on the tapping machine when the hammer is lifted by the catch mechanism. This impact could cause vibrations in the tapping machine, which in turn hamper the free fall of the other hammers, thus having an influence on the impact velocity and/or the time interval between impacts. However, in both cases a correlation is not observed in the results presented here.
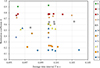 |
Figure 18 Relation between restitution coefficient and impact velocity. |
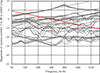 |
Figure 19 Relation between restitution coefficient and time interval between impacts. |
4 First attempt to predict the restitution coefficient
The experiments in Section 3.3 resulted in very different restitution coefficients covering nearly the full theoretical range between 0 and 1. This means that the level of the blocked force varies within ±3.0 dB according to the theory from Section 2. The level of the acting force will show the same variation since it follows directly from the level of the blocked force and the mobility ratio between source and receiver. The span of the acting force is thus comparatively large for many applications, e.g. for a prediction of an impact noise level.
To reduce this span it is tried to estimate the restitution coefficient based on the mechanical properties of the receiving structure. The usual descriptor for such purposes is the point mobility, so it was measured for all receiving structures. In most cases, the mobility measurement was performed using an impact hammer and two accelerometers, which were mounted as close as possible to the impact point. The receiver mobility Y R is then calculated using
 (9)
(9)
where v is the velocity obtained by averaging and integration of the measured acceleration spectra, and F is the force delivered by the impact hammer.
This method did not prove feasible for the setups with a foam or PVC layer on top. These materials show a distinguished local reaction to the impact of the hammer, which is not properly reflected by the adjacent accelerometers. In these cases, the mobility was determined indirectly by measuring the dynamic stiffness s and the loss factor η of the material. They are determined with a measurement setup where the material is loaded with an appropriate mass, thus forming a spring-mass system. The real and imaginary part of the receiver mobility then can be calculated as a function of frequency f by
 (10)
(10)
and
 (11)
(11)
For an overview, Figure 13 shows the absolute value of all measured mobilities, each averaged over the 5 hammer positions. The results show that, alike the restitution coefficients, a wide range of mobilities is covered by the selected floorings. The red line depicts the mobility for a hammer with a mass of 500 g.
The basic idea is now that the restitution coefficient depends on the mobility match between source and receiver. But as the mobility is frequency-dependent, while the restitution coefficient is a single number, a reasonable connection between these quantities is not straightforward. As an attempt to solve this problem, the sound power injected by a hammer of a tapping machine is considered since this heavily depends on the mobilities. It is, expressed in one-third octave bands [2],
 (12)
(12)
where F b, 1/3 oct is the blocked force in the respective frequency band, Y S is the mobility of the hammer mass (source), and Y R is the mobility measured on the flooring (receiver). Finally, the sum of the contributions from the one-third octave bands is calculated by
![Mathematical equation: $$ \begin{aligned} \mathrm{\Delta } L_{W,\mathrm \Sigma } =10 \mathrm{lg} \mathopen \mathclose {\left[ {\frac{1}{n}\sum _{i=1}^{n} \frac{P_{1/3\,\mathrm{oct} } }{P_{\mathrm{ref} } }} \right]}\,\mathrm{dB} \end{aligned} $$](/articles/aacus/full_html/2025/01/aacus240110/aacus240110-eq13.gif) (13)
(13)
with
 (14)
(14)
This reference power P ref is a theoretical maximum power calculated from the blocked force and the free velocity [2]. So, the summation in equation (13) is performed for the ratio between the really injected power and the theoretical maximum power.
The range of the included one-third octave bands spans from 50 Hz to an upper frequency, which is the frequency where the level of the excitation force drops by more than 3 dB.
The relation between the restitution coefficient and the power ratio is shown in Figure 20. The results from all tapping machines and all hammer positions are separately shown. Unfortunately, a clear correlation is not observed. Nevertheless, small power ratios seem to indicate a high restitution coefficient whereas larger power ratios are associated with a larger span of restitution coefficients. The latter is especially prominent for the laminate (L), where a power ratio of −3 dB is related to restitution coefficients between 0.3 and 0.8. For the other receivers, the results are within a small span of restitution coefficients and power ratios. Thus, the power ratio seems not to be a good descriptor to predict the restitution coefficient. The results could neither be improved by extending the included one-third octave bands to 5 kHz nor by including the imaginary part of the sound power.
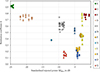 |
Figure 20 Relation between restitution coefficient and standardised injected power. |
5 Summary and outlook
The existing equation for the blocked force exerted by an ISO tapping machine was extended to the case of multiple impacts. Such multiple impacts can increase the blocked force level by up to 0.8 dB when the time between impact and hammer lift is smaller than 80 ms as required by ISO 10140-5 [1]. This finding was experimentally verified.
Furthermore, the restitution coefficient was measured for different floorings. It covered nearly the full theoretical span between 0 and 1. The actual blocked force level in a given situation therefore must be expected to show a variation within ±3 dB around the theoretical mean value of the blocked force level. It was furthermore shown that the restitution coefficient is very similar when different types of tapping machines are used on the same flooring. The relative standard deviation of the restitution coefficient was mostly below 10% for this experiment. This explains why impact noise measurements show only a slightly larger uncertainty than airborne sound insulation measurements according to [3].
It was also investigated whether the restitution coefficient influences the other quantities that determine the blocked force level, i.e. the impact velocity or the time between consecutive hammer impacts. Experiments showed that this is not the case. The restitution coefficient, the impact velocity and the time between hammer impacts can thus be regarded as independent quantities.
Finally, a first attempt was made to predict the restitution coefficient based on the injected sound power which was calculated from the mobility match between source and receiver and the blocked force. Whereas a small injected sound power seems to indicate a large restitution coefficient, a large injected power is related to a large span of restitution coefficients. It is therefore not possible to reduce the range of ±3 dB for the blocked force level on the base of this approach.
It is planned to use the findings from this paper to determine an uncertainty of the blocked force level of ISO-tapping machines and to develop a further method for verifying tapping machines which may be a sensible addition to the method currently described in ISO 10140-5 [1].
Cite this article as: Wittstock V. Bietz H. & Schmelzer M. 2025. The influence of the restitution coefficient and multiple impacts on the force exerted by ISO tapping machines. Acta Acustica, 9, 14. https://doi.org/10.1051/aacus/2025001.
Funding
The authors received no external funding to complete this research.
Conflicts of interest
The authors declare no conflict of interest.
Data availability statement
The data that support the findings of this study are available from the corresponding author upon reasonable request.
Author contribution statement
Conceptualisation (VW), Data collection and Software Development (HB, MS), Analysis (VW, HB, MS), Writing (VW, HB, MS).
References
- ISO 10140-5: 2021 Acoustics – Laboratory measurement of sound insulation of building elements – Part 5: requirements for test facilities and equipment. [Google Scholar]
- EN 15657: 2017 Acoustic properties of building elements and of buildings – Laboratory measurement of structure-borne sound from building service equipment for all installation conditions. [Google Scholar]
- ISO 12999-1: 2020 Acoustics – Determination and application of measurement uncertainties in building acoustics – Part 1: sound insulation. [Google Scholar]
- V. Wittstock, J. Scheck, M. Villot: Structure-borne sound sources in buildings – Estimating the uncertainty of source properties and installed power from interlaboratory test results. Acta Acustica 6 (2022) 16. [CrossRef] [EDP Sciences] [Google Scholar]
- J.-H. Rindel: Sound Insulation in Buildings. CRC Press, Boca Raton, FL, 2018. [Google Scholar]
- J. Brunskog, P. Hammer: The interaction between the ISO tapping machine and lightweight floors. Acta Acustica United with Acustica 29 (2003) 296–308. [Google Scholar]
- L. Cremer, M. Heckl, B.A.T. Petersson: Structure-Borne Sound. Springer, Berlin, 2005. [CrossRef] [Google Scholar]
- K. Buhlert: Bestimmung von Körperschallanregung durch Reziprozitätsuntersuchungen. VDI-Verlag GmbH Düsseldorf, 1981. [Google Scholar]
- A. Rabold, M. Buchschmid, A. Düster, G. Müller, E. Rank: Modelling the excitation force of a standard tapping machine on lightweight floor structures. Building Acoustics 17 (2010) 175–197. [CrossRef] [Google Scholar]
- J. Lietzén, J. Miettinen, M. Kylliäinen, S. Pajunen: Impact force excitation generated by an ISO tapping machine on wooden floors. Applied Acoustics 175 (2021) 107821. [CrossRef] [Google Scholar]
- E. Sonntag Trittschalldämmung, in: W. Fasold, W. Kraak, W. Schirmer, Eds. Technische Akustik. VEB Verlag Technik, Berlin, 1982. [Google Scholar]
- V. Wittstock: On the spectral shape of the sound generated by standard tapping machines. Acta Acustica United with Acustica 98 (2012) 301–308. [CrossRef] [Google Scholar]
Appendix A
Occurrence of multiple impacts
Figure A.1 shows the hammer height and Figure A.2 the hammer velocity as a function of time t for different restitution coefficients k. The hammer is released at t = 0. Its velocity decreases linearly whereas its height reduces parabolically. When the hammer height reaches 0, the hammer hits the ground. The hammer velocity immediately changes its sign and jumps to the velocity after the impact whereby the restitution coefficient k describes the ratio between the moduli of the hammer velocities before |vmax| and after the impact  . The hammer velocity decreases again and the hammer height follows a parabolic function of time.
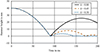 |
Figure A.1 Hammer height as a function of time for different restitution coefficients k. |
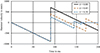 |
Figure A.2 Hammer velocity as a function of time for different restitution coefficients k. |
The time between the first and the second impact is
 (A.1)
(A.1)
The smaller the restitution coefficient k, the shorter the time between the first and the second impact t1. Resolving equation (A.1) with respect to k gives
 (A.2)
(A.2)
It follows from this that a second impact is avoided for a given time between the first hammer impact and lift of the hammer tlift when
 (A.3)
(A.3)
The time between the first and the third hammer impact is
 (A.4)
(A.4)
Solving this quadratic equation for k gives two solutions out of which only one is positive and thus physically meaningful
 (A.5).
A third hammer impact is avoided for a given tlift when
 (A.6)
(A.6)
All Tables
Setup of measurements on concrete block (TM1 and TM6 employed, except setup “Q”.)
All Figures
|
Figure 1 Increase of the level of the blocked force of an ISO tapping machine due to double and triple impacts according to equation (8) for different times between first hammer impact and hammer lift t lift. |
| In the text | |
|
Figure 2 Increase of the level of the blocked force of an ISO tapping machine according to equation (8) as a function of the falling height of the hammer for a fixed time between hammer impact and hammer lift of t lift = 80 ms and different restitution coefficients. |
| In the text | |
|
Figure 3 Velocity-signal of a single hammer impact (red) with threshold values (pink, blue, green) and the linear interpolations (black) before and after the impact. |
| In the text | |
|
Figure 4 Velocity-signal of a part of a single hammer impact (red) with the approximation (black) and the maximum value of this approximation (green). |
| In the text | |
|
Figure 5 Receiving plate with force sensor. |
| In the text | |
|
Figure 6 Different types of tapping machines positioned on the receiving plate. |
| In the text | |
|
Figure 7 Measured mobilities at the five force transducer positions (real parts and imaginary parts) and the mobility of a tapping machine hammer and of the force sensor. |
| In the text | |
|
Figure 8 Experimental setup for the measurement of the blocked force. |
| In the text | |
|
Figure 9 Typical course of calculated and measured force level. |
| In the text | |
|
Figure 10 Summary of the difference between directly measured and calculated blocked force. |
| In the text | |
|
Figure 11 Change in the measured L F, bl, meas and calculated L F, bl, calc blocked force when varying the falling height, tapping machine 1, hammer 3. |
| In the text | |
|
Figure 12 Difference of the measured blocked force level to the blocked force level at 41 mm falling height. Average values of blocked force level from 100 Hz to 500 Hz. |
| In the text | |
|
Figure 13 Absolute value of all measured receiver mobilities. The red line indicates the mobility of a typical hammer mass (500 g). |
| In the text | |
|
Figure 14 Overview of all measured restitution coefficients for different floorings. |
| In the text | |
|
Figure 15 Average restitution coefficient and related standard deviations for different tapping machines. The black line is 0.1k. |
| In the text | |
|
Figure 16 Overview of all measured impact velocities. |
| In the text | |
|
Figure 17 Overview of all measured time intervals between impacts. |
| In the text | |
|
Figure 18 Relation between restitution coefficient and impact velocity. |
| In the text | |
|
Figure 19 Relation between restitution coefficient and time interval between impacts. |
| In the text | |
|
Figure 20 Relation between restitution coefficient and standardised injected power. |
| In the text | |
|
Figure A.1 Hammer height as a function of time for different restitution coefficients k. |
| In the text | |
|
Figure A.2 Hammer velocity as a function of time for different restitution coefficients k. |
| In the text | |
Current usage metrics show cumulative count of Article Views (full-text article views including HTML views, PDF and ePub downloads, according to the available data) and Abstracts Views on Vision4Press platform.
Data correspond to usage on the plateform after 2015. The current usage metrics is available 48-96 hours after online publication and is updated daily on week days.
Initial download of the metrics may take a while.