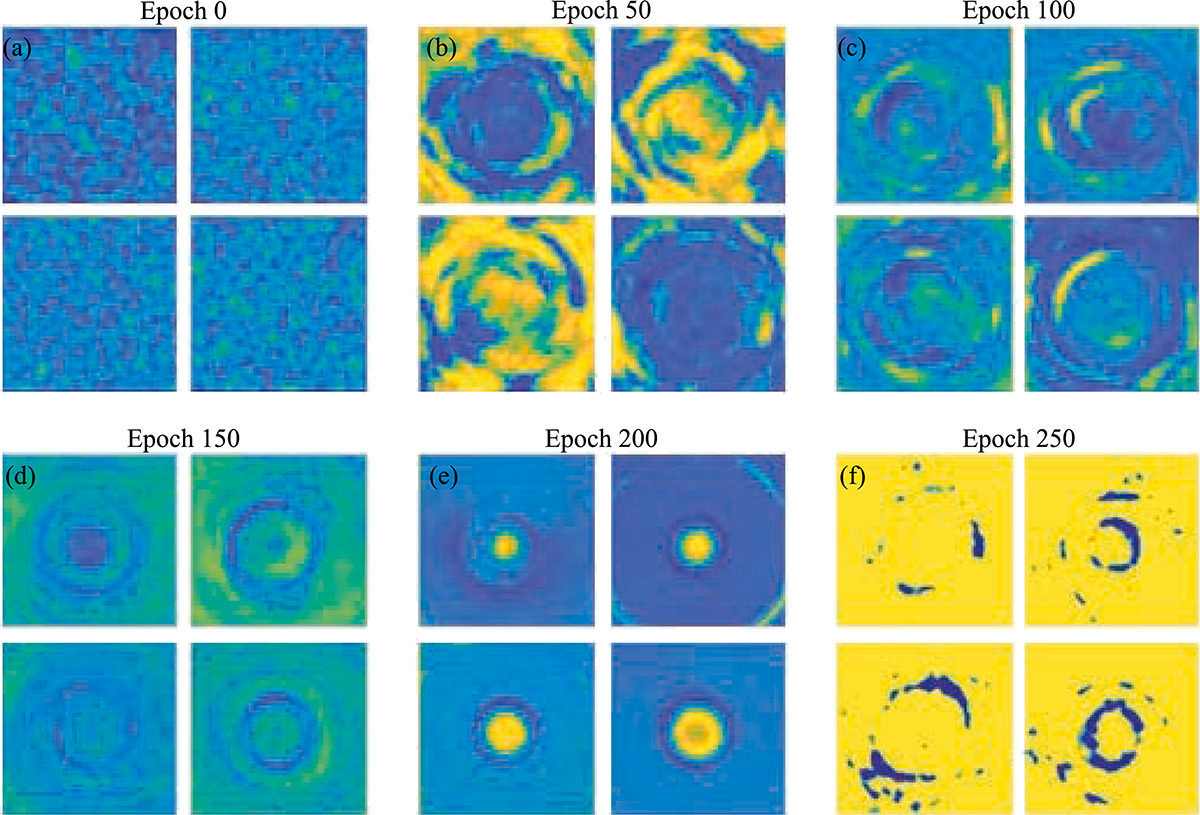
Figure 5

Download original image
Performance metrics and loss trends during training. (a) Generator loss curve, showing the training progression of the generator over 250 epochs. (b) Discriminator loss curves for real and fake samples, reflecting the discriminator’s ability to distinguish between generated and real data. (c) PSNR values over epochs, illustrating the quality of the generated outputs. (d) SSIM values across epochs, indicating the structural fidelity of the generated images.
Current usage metrics show cumulative count of Article Views (full-text article views including HTML views, PDF and ePub downloads, according to the available data) and Abstracts Views on Vision4Press platform.
Data correspond to usage on the plateform after 2015. The current usage metrics is available 48-96 hours after online publication and is updated daily on week days.
Initial download of the metrics may take a while.


