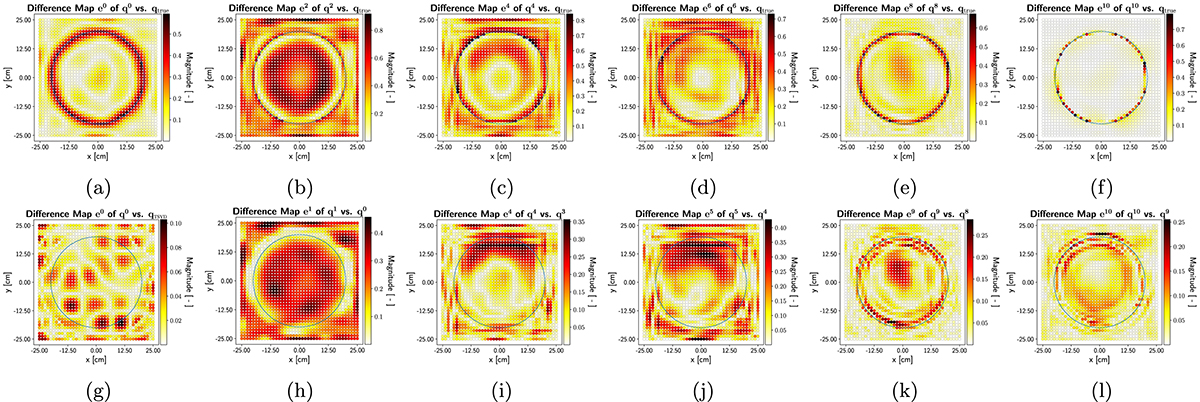
Figure 10.
Download original image
Spatial difference maps et of the VN according to equation (38) for the baffled circular piston in Figure 3b vibrating at f=1 kHz. The top row (a–f) shows the spatial difference between the even VN layer outputs qt of Figure 9(g–l) and the ground truth reference qref=qtrue in Figure 3b. The bottom row (g–l) shows the spatial difference between curated VN layer outputs qt and their respective layer inputs qref=qt−1.
Current usage metrics show cumulative count of Article Views (full-text article views including HTML views, PDF and ePub downloads, according to the available data) and Abstracts Views on Vision4Press platform.
Data correspond to usage on the plateform after 2015. The current usage metrics is available 48-96 hours after online publication and is updated daily on week days.
Initial download of the metrics may take a while.