| Issue |
Acta Acust.
Volume 9, 2025
|
|
|---|---|---|
| Article Number | 51 | |
| Number of page(s) | 12 | |
| Section | Audio Signal Processing and Transducers | |
| DOI | https://doi.org/10.1051/aacus/2025037 | |
| Published online | 12 August 2025 | |
Technical & Applied Article
Group delay-driven crossover optimization for subwoofer satellite systems at listening position
Department of New Media Music, Sangmyung University, Seoul, South Korea
* Corresponding author: This email address is being protected from spambots. You need JavaScript enabled to view it.
Received:
22
April
2025
Accepted:
15
July
2025
Abstract
This study explores the influence of crossover frequency on frequency response (FR) irregularities in 2.1-channel subwoofer-satellite systems at listening positions, introducing a data-driven optimization approach that focuses on minimizing the maximum absolute group delay (max|GD|) in low frequency range. While subwoofers paired with satellite speakers are increasingly employed for low-frequency reproduction, the role of phase-related effects, such as group delay (GD), in contributing to FR inconsistencies like amplitude dips has received limited attention in prior research. Experiments were carried out in two different rooms, with FR and GD analyzed over a crossover frequency range of 40–140 Hz. The findings suggest that minimizing max|GD| could reduce FR irregularities, with results from a Fixed Effects model indicating a statistically significant positive relationship between max|GD| and ΔGD-SPL (coefficient: 22.274, p-value < 0.0001). An optimization algorithm is proposed to identify a crossover frequency that minimizes max|GD|, offering a phase-focused approach that may enhance low-frequency reproduction for practical applications like studio monitoring and home audio.
Key words: Crossover frequency / Group delay / Subwoofer / Satellite speakers / Frequency response
© The Author(s), Published by EDP Sciences, 2025
 This is an Open Access article distributed under the terms of the Creative Commons Attribution License (https://creativecommons.org/licenses/by/4.0), which permits unrestricted use, distribution, and reproduction in any medium, provided the original work is properly cited.
1. Introduction
The significance of low-frequency reproduction in audio systems has increased, as evidenced by Oehler et al. [1]. Early studio monitors, such as Yamaha’s NS-10 m (discontinued in 2001), exhibited limited low-end response [2]. Today, 2.1-channel stereo systems, comprising two satellite speakers and a subwoofer, are widely used in studios for low-frequency reproduction. A key parameter in these systems is the crossover frequency (ω c ), which separates low frequencies handled by the subwoofer from higher frequencies assigned to the satellites. A suboptimally selected ω c may cause phase misalignment between the subwoofer and satellites, leading to group delay (GD). This GD can contribute to the frequency response (FR) through interference, such as phase cancellations at overlapping frequencies, resulting in amplitude dips.
To address these challenges, previous studies have explored crossover frequency optimization. Zacharov et al. evaluated subwoofer placement at Bang & Olufsen, finding 85 Hz sufficient for a single subwoofer at room boundaries [3]. Kelloniemi et al. noted that subwoofer positions became detectable above 120 Hz, with no clear dependence on listening angle near 30 degrees [4]. Bharitkar et al. [5] developed an algorithm to minimize spectral deviation in FR, quantified as:
 (1)
(1)
where ω
c
denotes the crossover frequency, σ
H
(ω
c
) represents the spectral deviation, P is the number of frequency points, Δ is the mean magnitude  , and |H(ω
i
)| is the FR magnitude at ω
i
. In their study, this approach achieved optimal results at 120 Hz by prioritizing FR flatness, yet it neglects phase effects, potentially overlooking narrow amplitude dips and volume imbalances, as discussed in Section 5.
, and |H(ω
i
)| is the FR magnitude at ω
i
. In their study, this approach achieved optimal results at 120 Hz by prioritizing FR flatness, yet it neglects phase effects, potentially overlooking narrow amplitude dips and volume imbalances, as discussed in Section 5.
Other work has explored subwoofer placement and quantity. Miller Synergy Core dismissed LFE below 40 Hz, advocating dual subwoofers in the 45–90 Hz range to mitigate room mode resonances [6]. Martens similarly noted improved spatial imaging with two subwoofers, contingent on low-frequency correlation [7].
In contrast to these methods, which often depend on subjective tuning or magnitude-focused metrics, this study proposes a data-driven approach to optimize ω c by minimizing the maximum absolute GD (max|GD|) over a defined frequency range. Excessive GD, caused by rapid phase shifts, misaligns signals and generates FR irregularities. This method tackles non-minimum-phase behavior prevalent in real rooms, addressing limitations of spectral deviation techniques, such as their insensitivity to narrow dips, as elaborated in Section 2.2.
2. Background
2.1. Filter and crossover frequency
In a subwoofer-satellite system, a crossover divides the signal into two paths: one passes through a low-pass filter to the subwoofer, while the other reaches the satellite speakers, which may apply high-pass filtering depending on the system design.
The Butterworth filter, a basic design, reduces amplitude by approximately 3 dB at the cutoff frequency [8]. Its slope increases by 6 dB/octave per order (or pole). Two identical Butterworth filters in series form a Linkwitz–Riley filter: two 1st-order filters create a 2nd-order Linkwitz–Riley filter, and two 2nd-order filters form a 4th-order version [9].
This study employs 4th-order Linkwitz–Riley filters for both subwoofer and satellite speakers. Unlike Butterworth filters, which produce a 3 dB gain at the crossover frequency when low-pass and high-pass cutoffs align, Linkwitz–Riley filters ensure unity gain summation for a flat FR. Their 4th-order design, featuring a 24 dB/octave roll-off, enhances frequency band separation and reduces overlap compared to lower-order options. Higher-order filters, such as 8th-order Linkwitz–Riley (48 dB/octave), were avoided due to increased phase distortion from additional stages, which could introduce excessive GD.
2.2. Phase and group delay
Phase describes a wave’s angular position within one cycle, ranging from 0 to 2π (360°) per cycle, with shifts of integer multiples of 2π considered equivalent. This concept is fundamental in audio systems, which are typically assumed to be linear time-invariant (LTI), maintaining a consistent input-output relationship over time.
GD, denoted  , measures the rate of phase change with frequency, unlike phase delay
  , which tracks absolute time shift [10]. In subwoofer-satellite systems, rapid phase shifts increase GD, introducing excessive GD and causing interference that can appear as FR irregularities in typical listening environments.
Room modes, caused by standing waves in enclosed spaces, often induce sharp phase transitions at modal frequencies. Although room modes are fundamentally modeled as second-order resonant systems, their group delay behavior near resonance is frequently approximated using Lorentzian-like expressions. For instance, a simplified resonant system can be represented by the first-order transfer function:
 (2)
(2)
where ω n is the modal frequency determined by room geometry, γ is a damping factor associated with energy dissipation, and ω is the angular frequency. This transfer function exhibits a phase response of:
 (3)
(3)
which, upon differentiation, yields a group delay of:
 (4)
(4)
This classical result captures the peak GD at ω = ω n , reflecting the characteristic phase shift caused by a resonant mode. Note that the expression in equation (4) is provided for conceptual illustration only and was not used as a fitting or approximation model in the analysis.
In this study, GD was extracted from measured phase responses using Room EQ Wizard (REW). REW calculates GD numerically from the derivative of the unwrapped phase response, based on logarithmic sine sweeps and FFT-based spectral analysis. This helps visualize and interpret GD features that may be influenced by room modes, reflections, or phase shifts introduced by crossover filters.
This study focuses on minimizing the maximum absolute GD,  , across a crossover frequency range of 40–140 Hz (as detailed in Sect. 3.4, or 40–120 Hz in Sect. 5). By reducing max|GD|, this approach mitigates not only phase distortions but also the combined effects of room modes, multiple modal interactions, reflections, non-minimum-phase behavior prevalent in real rooms, and phase distortions near the crossover frequency caused by the filters applied to subwoofer and satellite speakers. Unlike magnitude-based methods, such as Bharitkar et al.’s spectral deviation minimization (Eq. (1)) [5], which prioritize FR flatness and may overlook phase effects, GD minimization directly addresses these critical phase-related distortions.
2.2.1. Room EQ Wizard (REW)
Room EQ Wizard (REW) is a free software tool designed for acoustic measurement and analysis, widely used in research and professional audio applications. It provides functionalities including FR, impulse response, reverberation time (T 30, T 60), GD, and distortion analysis. Its sine sweep-based approach, using logarithmic sine sweeps as excitation signals, enables precise analysis of acoustic characteristics. The REW Application Programming Interface (API) supports automated measurement and data extraction, integrating seamlessly into signal processing workflows.
In this study, V5.40 beta 76 was employed to measure FR and GD, analyzing magnitude and phase responses. Measurements utilized a logarithmic sine sweep with a length of 256k samples, corresponding to a sweep duration of approximately 5.46 s at a sampling rate of 48 kHz. The impulse response was analyzed in the frequency domain using REW’s Fast Fourier Transform (FFT) processing, with a frequency step of approximately 0.37 Hz, corresponding to an FFT size of 131 072 points. The raw data spanned 0.37 Hz to 20 kHz, with specific bands selected for analysis. All measurements were conducted at a 48 kHz sampling rate, ensuring sufficient resolution for accurate FR estimation. Detailed equipment specifications and analyzed frequency bands are provided in Section 3.
2.2.2. LiveProfessor
LiveProfessor, developed by audioström, is a plugin host software for live sound applications on Windows and macOS, supporting Virtual Studio Technology (VST) and Audio Unit (AU) plugins for real-time audio processing [11].
In this study, LiveProfessor was chosen for its flexible signal routing capabilities, used to direct stereo signals to subwoofers and satellite speakers. It applied FabFilter Pro-Q3, an equalization plugin, to implement 4th-order Linkwitz–Riley filters by cascading two 2nd-order Butterworth filters, ensuring precise frequency division with minimal phase distortion–essential for consistent FR in the experimental setup.
3. Method
3.1. Equipment and measurement setup
This study examines the effects of crossover frequency on subwoofer-satellite systems in fixed listening environments, employing 4th-order Linkwitz–Riley filters. Measurements were conducted in two distinct rooms toidentify consistent FR and GD patterns. Satellite speakers, KEF R3 META and Genelec 1032C, were selected for their transparent manufacturer-provided measurements. Subwoofers included KEF Kube 15 MIE for its wide low-frequency range with a 15-inch woofer, EVE Audio TS108 to represent compact 8-inch subwoofers suitable for home use, and Genelec 7370A as a standard studio-grade subwoofer.
3.1.1. Room 1
dummy
-
Size: 4.7 m (length) × 2.7 m (width) × 2.35 m (height);
-
Subwoofers: KEF Kube 15 MIE (Subwoofer 1), EVE Audio TS108 (Subwoofer 2);
-
Satellite Speaker: KEF R3 META (powered by NAD C388 amplifier, Satellite Speaker Pair 1);
-
Measurement Tools: Earthworks M30 microphone, Antelope Orion Studio Synergy Core ADC/DAC;
-
Software: Room EQ Wizard (REW), LiveProfessor.
In Room 1, a single satellite speaker pair was used to assess crossover frequency effects in a small-room environment. The recommended listening position is typically located at 38% of the room length from the front wall, forming an equilateral triangle with the two satellite speakers at a 60-degree angle. However, to mitigate potential near-field effects from the subwoofer while also considering low-frequency room modes, the measurement microphone was positioned at 62% of the room length from the front wall (equivalently, 38% from the rear wall) instead. Measurements were conducted at five points, with the microphone offset by 0.15 m in the up, down, left, and right directions (width & height) from the central position, to capture spatial variations in the sound field. The basic microphone measurement position was aligned with the tweeter height.
The setup is depicted in Figure 1 for the length × width view and Figure 2 for the width × height view. Measurements included Satellite Speaker Pair 1 with either Subwoofer 1 or Subwoofer 2, as shown in Figures 1a, 1b, 2a, and 2b. Precise time alignment was applied, as described in Section 3.1.4, to compensate for timing differences and ensure phase coherence.
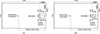 |
Figure 1. Measurement setups in Room 1 (length × width). (a) Subwoofer 1 and Satellite Speaker Pair 1. (b) Subwoofer 2 and Satellite Speaker Pair 1. |
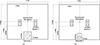 |
Figure 2. Measurement setups in Room 1 (width × height). (a) Subwoofer 1 and Satellite Speaker Pair 1. (b) Subwoofer 2 and Satellite Speaker Pair 1. |
3.1.2. Room 2
-
Size: 6.497 m (length) × 7.96 m (width) × 2.61 m (height);
-
Subwoofer: Genelec 7370A (Subwoofer 3);
-
Satellite Speaker: Genelec 1032C (Satellite Speaker Pair 2);
-
Measurement Tools: Earthworks M30 microphone, Avid Carbon ADC/DAC (with Universal Audio Volt 1 for subwoofer routing convenience);
-
Software: Room EQ Wizard (REW), LiveProfessor.
In Room 2, located at Sangmyung University, measurements were conducted in a larger space than Room 1 to explore the impact of room size on crossover optimization. Unlike Room 1, where subwoofer placement at the corner was not feasible due to constraints from cables and room acoustic materials, Subwoofer 3 was placed at two positions to evaluate whether crossover frequency optimization remains effective in a corner placement. Measurements were conducted at two positions: Position 1 at 38% of the room length from the front wall and Position 2 at 38% of the room length from the rear wall, which is equivalently 62% from the front wall. Measurement methods, including the use of five spatially offset points and time alignment, followed the same procedure as in Room 1. The setup is depicted in Figure 3.
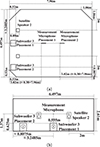 |
Figure 3. Measurement setups in Room 2. (a) Subwoofer 3 and Satellite Speaker Pair 2 (length × width). (b) Subwoofer 3 and Satellite Speaker Pair 2 (width × height). |
3.1.3. Experimental cases
The experimental cases were defined as follows:
-
Case 1: Subwoofer 1 and Satellite Speaker Pair 1 in Room 1.
-
Case 2: Subwoofer 2 and Satellite Speaker Pair 1 in Room 1.
-
Case 3: Subwoofer 3 and Satellite Speaker Pair 2 in Room 2, subwoofer at the center, measured at Placement 1.
-
Case 4: Subwoofer 3 and Satellite Speaker Pair 2 in Room 2, subwoofer at the center, measured at Placement 2.
-
Case 5: Subwoofer 3 and Satellite Speaker Pair 2 in Room 2, subwoofer in the corner, measured at Placement 1.
-
Case 6: Subwoofer 3 and Satellite Speaker Pair 2 in Room 2, subwoofer in the corner, measured at Placement 2.
3.1.4. Time alignment
Time delays were measured at the sample level with RTL Utility, which typically assesses internal latency via line output/input, but in this study, a measurement microphone (Earthwork m30) was connected as the input and speakers as the output to measure latency between subwoofer and satellite signals. These measurements were corrected to 0.1 ms precision in LiveProfessor to adjust temporal coherence. The measured latency values for each case, including the average latency of satellite speakers and subwoofers, as well as their differences, are summarized in Table 1.
Latency measurements for time alignment.
Phase alignment was adjusted using REW measurements of the wrapped phase at 85 Hz, a frequency selected as a reference within the typical crossover range. The choice of 85 Hz aligns with the Genelec 7300 Series manual, which uses 85 Hz as the default crossover frequency for centralized bass management and recommends an 85 Hz test tone for phase alignment [12]. While a test tone was not used in this study, 85 Hz was chosen as a practical reference frequency for consistency with industry standards. The wrapped phase differences between the satellite speakers and subwoofers were calculated and minimized by adjusting the subwoofer phase control settings. For Subwoofer 1 and Subwoofer 2, which support phase settings of 0 degrees or 180 degrees, the phase was set to the value closest to the measured absolute phase difference. For Subwoofer 3, which allows phase adjustments in 90-degree increments, the phase was set accordingly. The phase measurements and resulting absolute differences for each case are based on the first of three measurements per case, as the second and third measurements showed no significant variation, and are presented in Table 2.
Wrapped phase measurements at 85 Hz for phase alignment.
This alignment process ensures that phase-induced interference is minimized at the crossover frequency, supporting the subsequent GD minimization process detailed in Section 2.2.
3.1.5. Volume calibration
The SPL of the satellite speakers was initially calibrated to approximately 83 dB (C-weighted) using pink noise without the subwoofer, following the volume level suggested by Bob Katz [13]. Subsequently, with the subwoofer engaged and a crossover frequency of 140 Hz (the upper bound of the tested range) applied, the combined output was adjusted to target 83 dB (C-weighted), adhering to EBU R 128 loudness standards [14]. SPL measurements were performed using a BENETECH GM1356 microphone (35–130 dB range, 0.1 dB resolution, 2 measurements/sec). To confirm the subwoofers’ response, FR measurements were conducted within 1 cm from each subwoofer in LFE mode, with their built-in low-pass filters set to the maximum frequency to reduce phase distortion. Three repeated measurements were performed, and due to their consistency, a representative measurement is shown in Figure 4, unlike the averaged frequency response graphs (Figs. 5a–6c) which combine multiple spatial and trial measurements. Once set, the volume controls remained fixed, and only the crossover frequency was adjusted for subsequent tests.
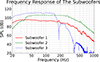 |
Figure 4. Frequency response measurements within 1 cm for Subwoofer 1 (KEF Kube 15 MIE), Subwoofer 2 (EVE Audio TS108), and Subwoofer 3 (Genelec 7370A) in LFE mode, with built-in low-pass filters set to maximum frequency. The plot shows a representative measurement from three repeated tests, as results were consistent across trials. |
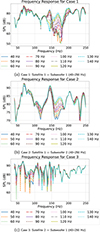 |
Figure 5. Frequency response for Cases 1–3. (a) Case 1: Satellite 1 + Subwoofer 1 (40–250 Hz). (b) Case 2: Satellite 1 + Subwoofer 2 (40–250 Hz). (c) Case 3: Satellite 2 + Subwoofer 1 (40–250 Hz). |
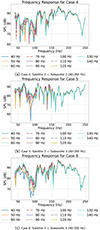 |
Figure 6. Frequency response for Cases 4–6. (a) Case 4: Satellite 2 + Subwoofer 2 (40–250 Hz). (b) Case 5: Satellite 3 + Subwoofer 3 (40–250 Hz). (c) Case 6: Satellite 3 + Subwoofer 4 (40–250 Hz). |
Spinorama graphs for the satellite speakers are provided by the manufacturers. For Satellite Speaker 1 pair, the graph is included in the KEF R Meta White Paper [15]. For Satellite Speaker 2 pair, the graph is available in the Genelec 1032C Operating Manual [16]. These graphs suggest that, within the frequency range of interest, sound pressure levels exhibit a subtle, consistent, and continuous decrease in the lower frequencies, rather than irregular variations.
3.1.6. Crossover filtering
As detailed in Section 2.2.2, 4th-order Linkwitz–Riley filters were applied to subwoofers and satellite speakers using FabFilter Pro-Q3 in LiveProfessor, cascading two 2nd-order Butterworth filters. Crossover frequencies ranged from 40 Hz to 140 Hz in 10 Hz steps, selected via grid search to systematically assess GD and FR variations across this range.
3.2. Quantitative objective function
The optimal crossover frequency, ω oc, was determined by minimizing GD, as expressed in the following equation:
 (5)
(5)
where:
-
Optimal crossover frequency;
-
Minimum and maximum crossover frequency bounds;
-
Adjustment factors to extend the analysis range beyond the crossover frequencies, capturing significant max|GD| variations observed during experiments (detailed in Sect. 3.4);
-
GD at frequency ωi.
Furthermore, by representing ϕ(ω) as the phase response of the FR H(ω), it can also be formulated as:
 (6)
(6)
where H(ω)=|H(ω)|e j ϕ(ω) combines magnitude |H(ω)| and phase ϕ(ω). This method aims to minimize max|GD| and to reduce phase-induced FR irregularities, assuming precise time alignment as detailed in Section 3.1.4. The GD Minimization Effectiveness Score (E GD,Max) quantifies the reduction in max|GD| from a baseline to the optimized crossover frequency:
 (7)
(7)
where:
-
The maximum absolute GD at the baseline crossover frequency;
-
The maximum absolute GD at the ω c .
The baseline was set to 40 Hz, a common LFE crossover frequency often adopted in consumer audio systems. E GD,Max measures the percentage decrease in peak GD, with higher values indicating greater GD reduction.
3.3. Evaluation metrics for frequency response consistency
To evaluate the impact of GD on FR consistency, the GD-SPL difference (ΔGD-SPL) was calculated for each measurement across all experimental cases. For each case, 33 measurements were collected at the basic position (3 trials × 11 crossover frequencies, ranging from 40 Hz to 140 Hz in 10 Hz steps). The ΔGD-SPL quantifies the SPL reduction at the frequency where the max|GD| occurs, relative to the average SPL across a specified frequency range, and is defined as:
 (8)
(8)
where:
-
Frequency where max|GD| occurs.
-
Average SPL over the range ω LC + α to ω HC + β, calculated as:
where N is the number of interpolation points, and ω k are frequencies within the specified range.
-
SPL at ω GD in dB.
To assess the causal relationship between max|GD| and ΔGD-SPL, a Fixed Effects (FE) model was applied to a panel dataset of 198 observations (6 cases × 33 measurements per case). The FE model controls for unobserved case-specific heterogeneity and is specified as:
 (9)
(9)
where:
-
Case index (1 to 6).
-
Measurement index (1 to 33 per case).
-
GD-SPL difference for case i at measurement t.
-
Maximum absolute GD for case i at measurement t.
-
Intercept.
-
Coefficient of max|GD|, representing its causal effect on ΔGD-SPL.
-
Case-specific fixed effect.
-
Error term.
The model was estimated using clustered standard errors to account for potential within-case correlation, focusing on within-case variations to evaluate whether minimizing max|GD| reduces FR irregularities. The estimation results are presented in Section 4.3.
3.4. Export data
GD values were derived by decoding base64-encoded data from REW measurements using Python, with the unique identifier (UUID) extracted to access the data. For Cases 1 and 2, the analysis range for equations (5) and (6) was set with α = 0, β = 110, spanning 40–250 Hz, to capture significant max|GD| variations beyond the maximum crossover frequency of 140 Hz, as substantial GD peaks were observed at 233–235 Hz (Tabs. 3 and 4 in Sect. 4.1). For Cases 3–6, as shown in Section 4.2, the frequency response (FR) graphs above 170 Hz exhibited minimal changes with variations in crossover frequency, leading to the adoption of α = 0, β = 30, corresponding to a 40–170 Hz range, to focus the analysis on the region with significant GD and FR variations.
Maximum absolute value of GD (s) for different crossover frequencies (Case 1: Satellite 1 +Subwoofer 1).
Maximum absolute value of GD (s) for different crossover frequencies (Case 2: Satellite 1 +Subwoofer 2).
As noted in Section 2.2.1, measurements had a frequency step of approximately 0.37 Hz. Cubic interpolation was applied to smooth rapid FR and GD changes, dividing the 40–250 Hz range into 210 000 points (in Cases 3–6, 40–170 Hz range into 130 000 points).
The Python project for GD data export is available at Zenodo [17]. FR data, including SPL (dB) at 0.37 Hz intervals, were extracted as text files via the REW API and interpolated to 1000 points per Hz for graphing in Python.
Raw measurement data and average FRs, including subwoofer proximity measurements, are available in [18].
3.5. Limitations
This approach conducted measurements in two rooms, which may not capture the full range of acoustic conditions present in rooms of varying sizes, shapes, or materials. The choice of specific subwoofer and satellite speaker models may limit the applicability of these findings to other equipment configurations. Likewise, the crossover frequency range of 40–140 Hz was explored. While this broad range, extending up to 140 Hz, was chosen to provide sufficient experimental data points across varied conditions for robust statistical analysis and methodvalidation, it is important to note that crossover frequencies at the upper end of this range are generally not recommended for practical subwoofer-satellite system setup. This is primarily due to the potential for audibility of the subwoofer’s location at higher frequencies, as indicated by perceptual studies [3, 4]. Thus comparisons with Bharitkar et al.’s method [5] were conducted up to 120 Hz in Section 5. The dependence on precise time alignment (Sect. 3.1.4) may not be feasible in systems with less consistent alignment accuracy.
Additionally, this study did not define a universal threshold for acceptable GD or SPL dip size, as their perceptual impact remains uncertain (Sect. 5). Measurements were conducted at fixed positions (Sect. 3.1), optimized within ±0.15 m, and larger deviations may reduce optimization effectiveness.
4. Results and analysis
The experimental conditions for Cases 1–6 are detailed in Section 3.1. Measurements were conducted three times per case, with standard deviations in Tables 3–8 representing the sample standard deviation of the three raw max|GD| measurements at each crossover frequency. FR graphs (Figs. 5a–6c) represent the average of 15 measurements per crossover frequency, comprising three repeated trials and five spatially offset positions, to ensure robust representation of the sound field.
Maximum absolute value of GD (s) for different crossover frequencies (Case 3: Satellite 2 +Subwoofer 3).
Maximum absolute value of GD (s) for different crossover frequencies (Case 4: Satellite 2 +Subwoofer 3).
Maximum absolute value of GD (s) for different crossover frequencies (Case 5: Satellite 2 +Subwoofer 3).
Maximum absolute value of GD (s) for different crossover frequencies (Case 6: Satellite 2 +Subwoofer 3).
4.3. Statistical and comparative insights
The FE model results, estimating the causal relationship between max|GD| and ΔGD-SPL, are summarized in Table 10. The model reveals a statisticallysignificant effect of max|GD| on ΔGD-SPL, with a coefficient of 22.274 (p-value < 0.0001). This indicates that a1-unit increase in max|GD| leads to an average increase of 22.274 dB in ΔGD-SPL, with a 95% confidence interval of [15.760, 28.787]. The R-squared (Within) value of 0.2633 shows that max|GD| explains approximately 26.33% of the within-case variation in ΔGD-SPL. This R-squared value suggests that the variability in  is influenced by a range of complex and interrelated acoustic factors, such as room modes, reflections, or non-minimum phase characteristics, which are inherent to real-world listening environments. Despite the contribution of these factors, the F-test for poolability (F = 16.617, p-value < 0.0001) confirms significant differences across cases, supporting the use of the FE model.
Fixed effects model results for the effect of max|GD| on ΔGD-SPL.
Table 11 provides descriptive statistics of max|GD| and ΔGD-SPL at specific crossover frequencies for each case. The table reports the maximum and minimum max|GD| values across the 33 measurements per case, along with the corresponding ΔGD-SPL values and crossover frequencies (ωc). For Cases 1–5, minimizing max|GD| reduces ΔGD-SPL from 20.02–44.38 dB to 9.69–18.69 dB. In Case 6, ΔGD-SPL decreases from 35.59 dB at 100 Hz to 11.41 dB at 40 Hz, a 24.18 dB improvement.
Maximum and minimum max|GD| and corresponding ΔGD-SPL across cases.
To explore practical applicability within a perceptually more constrained range, the optimal crossover frequencies within 40–120 Hz were additionally analyzed (Tab. 12). This range was chosen, in part, based on perceptual studies suggesting subwoofer localization might become discernible above 85–120 Hz [3, 4]. Table 12 appears to indicate that the GD minimization approach tends to remain effective in this range, potentially showing reductions in max|GD| and ΔGD-SPL, suggesting its possible relevance for studio and home audio applications.
Optimal crossover frequencies, maximum absolute value of GD, E GD,Max, and ΔGD-SPL in the 40–120 Hz range across cases.
4.1. GD minimization results
Detailed max|GD| values across crossover frequencies are provided in Tables 3–8. Few cases exhibit notable variability in max|GD| or the frequency at which it occurs, as indicated by the standard deviations. For instance, in Case 1 at 60 Hz, a high standard deviation (0.1337) was observed due to variability in the measured max|GD| values across trials, with one measurement yielding a noticeably higher value than others, despite consistentfrequencies with maximum GD around 167–175 Hz. This variability likely results from phase cancellation instabilities at this frequency. Cases 1–5 show optimal crossover frequencies (ωoc) ranging from 60 Hz to 140 Hz, with EGD,Max ranging from 20.2% to 66.7%, as summarized in Table 9. In contrast, Case 6 yields ωoc = 40 Hz and EGD,Max = 0.0%, as 40 Hz serves as the baseline frequency.
Summary of optimal crossover frequencies, maximum absolute value of GD, and E GD,Max across cases.
4.2. FR analysis
Figures 5a–6c show FR variations across all tested crossover frequencies. In Cases 1–5, minimizing max|GD| at optimal crossover frequencies (60–140 Hz) reduces SPL dips, as observed in the graphs. This reduction is quantitatively validated in Section 4.3. In Case 6, where max|GD| is minimized at 40 Hz, larger SPL dips appear at higher crossover frequencies, indicating a distinct optimal crossover response compared to Cases 1–5.
These findings confirm that minimizing max|GD| effectively reduces FR irregularities, as evidenced by the significant causal effect in the FE model and the consistent patterns observed in the descriptive statistics.
dummy
5. Discussion
Minimizing max|GD| appears to offer a potential approach for reducing GD and FR irregularities in subwoofer-satellite systems, possibly improving time-domain accuracy for applications such as studio monitoring and home audio. Across Cases 1–6, this method seems associated with lower ΔGD-SPL and reduced SPL dips, as suggested by statistical findings in Section 4.3 and visually indicated by Figures 5a–6c. The experimental range of 40–140 Hz provided data exploring the method’s applicability across various crossover frequencies.
While the method generally shows association with reduced ΔGD-SPL across cases, Case 6 presents a distinct result. In Case 6, with max|GD| minimized at the 40 Hz baseline (Eq. (7)), an EGD,Max of 0.0% was observed, unlike Cases 1–5 (Tab. 9). This indicates that 40 Hz was the optimal frequency for minimizing max|GD| in this specific setup. The ΔGD-SPL at 40 Hz was 11.41 dB, which is significantly lower than the 35.59 dB observed at 100 Hz (Tab. 12), a frequency associated with a higher max|GD| in this case. This suggests that in certain conditions, the baseline frequency may already represent the minimum max|GD| point within the tested range.
To compare with prior methods, the spectral deviation metric from Bharitkar et al. [5] was applied to interpolated FR data (in Cases 1–2, 40–250 Hz, in Cases 3–6, 40–170 Hz, 0.001 Hz spacing), constrained to the crossover frequency practical range of 40–120 Hz. Table 13 presents the optimal crossover frequencies (ωoc) and minimum spectral deviations (σH) for this comparison, where lower σH may suggest improved FR flatness. Comparison shows the Bharitkar method aligns with max|GD| minimization in Cases 1, 2, and 4 (all selecting 120 Hz within this range), but may differ in Cases 3 (90 Hz for Bharitkar vs. 110 Hz for max|GD|), 5 (120 Hz for Bharitker vs. 60 Hz for max|GD|) and 6 (120 Hz for Bharitkar vs. 40 Hz for max|GD|). These differences suggest that while the Bharitkar method prioritizes FR flatness (σH) it may not fully address phase-related distortions, which are more directly targeted by minimizing (max|GD|). This aligns with the observed ΔGD-SPL trends for the respective optimal frequencies (Tab. 11).
Optimal crossover frequencies and minimum spectral deviations using Bharitkar et al. method (40–120 Hz).
The statistical analysis in Section 4.3 highlights that the FE model’s relatively low R-squared (0.2633) indicates that max|GD| explains only a portion of the variation in ΔGD-SPL, suggesting that environmental factors like room modes and reflections play a significant role. This is particularly evident in Cases 3 and 5, conducted in Room 2, where pronounced low-frequency comb filtering is observed in Figures 5c and 6b. This comb filtering is likely caused by interference from reflected waves off Room 2’s reflective surfaces, such as marble or concrete flooring, which create rapid phase shifts and amplitude dips in the FR. These effects are more noticeable at closer listening positions (Case 3 and 5) compared to Cases 4 and 6.
To further explore the impact of room acoustics, FR irregularities were analyzed in relation to room modes. In Cases 1 and 2, conducted in Room 1 (1.7 m × 2.7 m × 2.35 m), notable SPL dips are observed around 116 Hz and 233 Hz in Figures 5a and 5b. These dips likely result from room modes, calculated based on Room 1’s dimensions. Specifically, the 233 Hz region corresponds to multiple higher-order modes, including tangential modes (0–2–3, 0–6–1, 0–5–2 at 230.78–233.65 Hz) and oblique modes (1–1–3, 3–3–1, 2–5–1 at 230.87–233.99 Hz), as derived from the room mode equation  , where c is the speed of sound (340 m/s), and L, W, H are the room dimensions. These modes overlap near 233 Hz, amplifying phase cancellations and resulting in prominent FR dips. Notably, the 116 Hz dip varies with changes in crossover frequency (ω
c
), reflecting crossover-related phase interactions, whereas the 233 Hz dip remains consistent across ω
c
, indicating its dominance by room modes. As this frequency range lies above the subwoofer’s primary operating region (40–140 Hz), the observed irregularities are predominantly driven by room characteristics rather than crossover effects.
, where c is the speed of sound (340 m/s), and L, W, H are the room dimensions. These modes overlap near 233 Hz, amplifying phase cancellations and resulting in prominent FR dips. Notably, the 116 Hz dip varies with changes in crossover frequency (ω
c
), reflecting crossover-related phase interactions, whereas the 233 Hz dip remains consistent across ω
c
, indicating its dominance by room modes. As this frequency range lies above the subwoofer’s primary operating region (40–140 Hz), the observed irregularities are predominantly driven by room characteristics rather than crossover effects.
Similarly, in Room 2 (6.497 m × 7.96 m × 2.61 m), Cases 3 and 5 (measured at Position 1, 3.02 m from the front wall) and Cases 4 and 6 (measured at Position 2, 3.02 m from the rear wall) exhibit comparable FR patterns above approximately 170 Hz, as shown in Figures 5c, 6b, 6a, and 6c.
GD minimization appears beneficial but may not fully mitigate FR irregularities caused by environmental factors, particularly above the subwoofer’s primary range. To mitigate such influences, this phase-centric approach might be combined with physical acoustic treatments, room construction improvements, or optimized speaker and listening position placement. For instance, integrating acoustic materials, such as melamine foams withoptimized pore size polydispersity for low-frequency absorption [19], or edge absorbers designed to reduce low-frequency reverberation [20], could enhance the effectiveness of GD minimization by mitigating room modes and comb filtering observed in Cases 3 and 5. Such combined strategies may lead to more consistent FR and improved audio quality in practical settings.
For practical deployment, particularly in applications like studio monitoring and home audio, prioritizing crossover frequencies within the perceptually relevant range of 40–120 Hz might be advisable. This range is typically constrained to help prevent subwoofer localization, aligning with perceptual studies [3, 4]. Table 12 summarizes the optimal crossover frequencies and max|GD| reductions specifically within this range, suggesting the potential applicability and benefits of the GD minimization approach even when limited to perceptually appropriate settings.
Future studies could explore this method in diverse acoustic setups, potentially refining crossover optimization for specific environments. Research by Liski et al. [21, 22] indicates that GD variations above 300 Hz are perceptible (thresholds ∼0.64 ms), but the perceptual impact of low-frequency GD below 120 Hz remains an area for further investigation. Controlled listening tests, possibly incorporating varied room acoustics, could help clarify its effect on perceived audio quality and the overall impact of GD minimization in practical scenarios.
6. Conclusion
This study suggests that minimizing max|GD| may offer a phase-centric approach to potentially reducing FR irregularities in subwoofer-satellite systems. Across various experimental setups, this method appears to support improved low-frequency consistency, as explored in Section 5.
For practical applications such as studio monitoring or home audio, selecting crossover frequencies within the perceptually relevant 40–120 Hz range may help minimize subwoofer localization issues [3, 4]. To minimize room mode effects, listening positions in this study were set at 38% and 62% of the room length from the front wall (within ±0.15 m), but the effectiveness of this approach in other positions, such as those where near-field effects occur due to proximity to the subwoofer, remains uncertain. The presence of environmental factors like room modes and reflections suggests that combining this method with physical acoustic treatments or optimized speaker placement could further enhance flatter FR. Crossover frequencies above 120 Hz might be considered less suitable for practical use due to potential localization issues. Future studies could explore this method’s effectiveness at non-optimal listening positions, such as near-field or off-axis locations.
The GD-based approach appears applicable across the tested room and speaker setups, providing a systematic method for crossover optimization focused on phase effects. This method could potentially offer engineers a practical tool to enhance low-frequency reproduction in studio environments and is likely relevant for consumer home audio systems utilizing subwoofers.
Fundings
This research received no specific grant from any funding agency in the public, commercial, or not-for-profit sectors.
Conflicts of interest
The author declares no conflict of interest.
Data availability statement
The Python code for data analysis is available in Zenodo, under the reference [17]. The research data associated with this article are available in Zenodo, under the reference [18].
References
- M. Oehler, C. Reuter, I. Czedik-Eysenberg: Dynamics and low-frequency ratio in popular music recordings since 1965, in: Audio Engineering Society Conference: 57th International Conference: The Future of Audio Entertainment TechnologyCinema, Television and the Internet. Audio Engineering Society, Hollywood, CA, USA, 2015, pp. 1–8. [Google Scholar]
- K.R. Holland: The Yamaha NS10M: twenty years a reference monitor. Why? Institute of Acoustics 23 (2001) 29–38. [Google Scholar]
- N. Zacharov, S. Bech, D. Meares: The use of subwoofers in the context of surround sound program reproduction. Journal of the Audio Engineering Society 46 (1998) 276–287. [Google Scholar]
- A. Kelloniemi, J. Ahonen, O. Paajanen, V. Pulkki: Detection of subwoofer depending on crossover frequency and spatial angle between subwoofer and main speaker, in: Proceedings of 118th Convention of the Audio Engineering Society. Barcelona, Spain, 2005, paper 6431. [Google Scholar]
- S. Bharitkar, C. Kyriakakis: Automatic crossover frequency selection for multichannel home-theater applications, in: Proceedings of IEEE International Conference on Multimedia and Expo (ICME), Amsterdam, The Netherlands, 2005, pp. 1–4. [Google Scholar]
- R. Miller III: Physiological and content considerations for a second low-frequency channel for bass management, subwoofers, and LFE, in: Proceedings of 118th Convention of the Audio Engineering Society, Barcelona, Spain, 2005, paper 6628. [Google Scholar]
- W.L. Martens: The impact of decorrelated low-frequency reproduction on auditory spatial imagery: Are two subwoofers better than one? in: Proceeding of 16th International Conference on Audio Engineering Society, Spatial Sound Reproduction, Rovaniemi, Finland, 1999, paper 16-006. [Google Scholar]
- S. Butterworth: On the theory of filter amplifiers. Wireless Engineer 7 (1930) 536–541. [Google Scholar]
- S.H. Linkwitz: Active crossover networks for noncoincident drivers. Journal of the Audio Engineering Society 24 (1976) 2–8. [Google Scholar]
- R.C. Heyser: Loudspeaker phase characteristics and time delay distortion: Part 1. Journal of the Audio Engineering Society 17 (1969) 30–41. [Google Scholar]
- Audioström: LiveProfessor: live-oriented plugin host for audio processing, https://audiostrom.com/liveprofessor , accessed: February 25, 2025. [Google Scholar]
- Genelec: Operating manual 7300 series Genelec 7360A and 7370A smart active subwoofers, https://assets.ctfassets.net/4zjnzn055a4v/2xfj0AkjCUMkM4msUE0Aiw/abf7c0a2fe9860608d89b063fe51254c/7360_and_7370_op-man_a_0.pdf, accessed: April 17, 2025. [Google Scholar]
- B. Katz: Mastering Audio: The Art and the Science, 3rd edn. Focal Press, Oxford, 2014. [Google Scholar]
- European Broadcasting Union: EBU R 128: Loudness normalisation and permitted maximum level of audio signals. Tech. Rep., Geneva, Switzerland, 2014, https://tech.ebu.ch/publications/r128. [Google Scholar]
- KEF: R Meta White Paper: R Series with MAT, https://us.kef.com/pages/documents, accessed: July 9, 2025. [Google Scholar]
- Genelec: Operating manual: Genelec 1032C, https://www.genelec.com/1032c, accessed: July 9, 2025. [Google Scholar]
- J. Kim: A python code for exporting REW (Room EQ Wizard) group delay data [Program]. Zenodo. https://doi.org/10.5281/zenodo.15847752, 2025. [Google Scholar]
- J. Kim: REW measurement data for the study, group delay-driven crossover optimization for subwoofer satellite system at listening position [Data set]. Zenodo. https://doi.org/10.5281/zenodo.15250615, 2025. [Google Scholar]
- C.T. Nguyen, D. Li, Z. Xiong, M. He, L. Gautron, A. Duval, C. Perrot: Structure-property relationships of polydisperse open-cell foams: application to melamine foams. Acta Acustica 8 (2024) 42. [Google Scholar]
- F. Kraxberger, E. Kurz, W. Weselak, G. Kubin, M. Kaltenbacher, S. Schoder: A validated finite element model for room acoustic treatments with edge absorbers. Acta Acustica 7 (2023) 44. [Google Scholar]
- J. Liski, A. Mäkivirta, V. Välimäki: Audibility of group-delay equalization. IEEE/ACM Transactions on Audio, Speech, and Language Processing 29 (2021)2189–2201. [Google Scholar]
- J. Liski, A. Mäkivirta, V. Välimäki: Audibility of loudspeaker group-delay characteristics, in: Proceedings of 144th Convention on Audio Engineering Society, Milan, Italy, 2018, pp. 879–888. [Google Scholar]
Cite this article as: Kim J. 2025. Group delay-driven crossover optimization for subwoofer satellite systems at listening position. Acta Acustica, 9, 51. https://doi.org/10.1051/aacus/2025037.
All Tables
Maximum absolute value of GD (s) for different crossover frequencies (Case 1: Satellite 1 +Subwoofer 1).
Maximum absolute value of GD (s) for different crossover frequencies (Case 2: Satellite 1 +Subwoofer 2).
Maximum absolute value of GD (s) for different crossover frequencies (Case 3: Satellite 2 +Subwoofer 3).
Maximum absolute value of GD (s) for different crossover frequencies (Case 4: Satellite 2 +Subwoofer 3).
Maximum absolute value of GD (s) for different crossover frequencies (Case 5: Satellite 2 +Subwoofer 3).
Maximum absolute value of GD (s) for different crossover frequencies (Case 6: Satellite 2 +Subwoofer 3).
Optimal crossover frequencies, maximum absolute value of GD, E GD,Max, and ΔGD-SPL in the 40–120 Hz range across cases.
Summary of optimal crossover frequencies, maximum absolute value of GD, and E GD,Max across cases.
Optimal crossover frequencies and minimum spectral deviations using Bharitkar et al. method (40–120 Hz).
All Figures
|
Figure 1. Measurement setups in Room 1 (length × width). (a) Subwoofer 1 and Satellite Speaker Pair 1. (b) Subwoofer 2 and Satellite Speaker Pair 1. |
| In the text | |
|
Figure 2. Measurement setups in Room 1 (width × height). (a) Subwoofer 1 and Satellite Speaker Pair 1. (b) Subwoofer 2 and Satellite Speaker Pair 1. |
| In the text | |
|
Figure 3. Measurement setups in Room 2. (a) Subwoofer 3 and Satellite Speaker Pair 2 (length × width). (b) Subwoofer 3 and Satellite Speaker Pair 2 (width × height). |
| In the text | |
|
Figure 4. Frequency response measurements within 1 cm for Subwoofer 1 (KEF Kube 15 MIE), Subwoofer 2 (EVE Audio TS108), and Subwoofer 3 (Genelec 7370A) in LFE mode, with built-in low-pass filters set to maximum frequency. The plot shows a representative measurement from three repeated tests, as results were consistent across trials. |
| In the text | |
|
Figure 5. Frequency response for Cases 1–3. (a) Case 1: Satellite 1 + Subwoofer 1 (40–250 Hz). (b) Case 2: Satellite 1 + Subwoofer 2 (40–250 Hz). (c) Case 3: Satellite 2 + Subwoofer 1 (40–250 Hz). |
| In the text | |
|
Figure 6. Frequency response for Cases 4–6. (a) Case 4: Satellite 2 + Subwoofer 2 (40–250 Hz). (b) Case 5: Satellite 3 + Subwoofer 3 (40–250 Hz). (c) Case 6: Satellite 3 + Subwoofer 4 (40–250 Hz). |
| In the text | |
Current usage metrics show cumulative count of Article Views (full-text article views including HTML views, PDF and ePub downloads, according to the available data) and Abstracts Views on Vision4Press platform.
Data correspond to usage on the plateform after 2015. The current usage metrics is available 48-96 hours after online publication and is updated daily on week days.
Initial download of the metrics may take a while.