Figure 4.
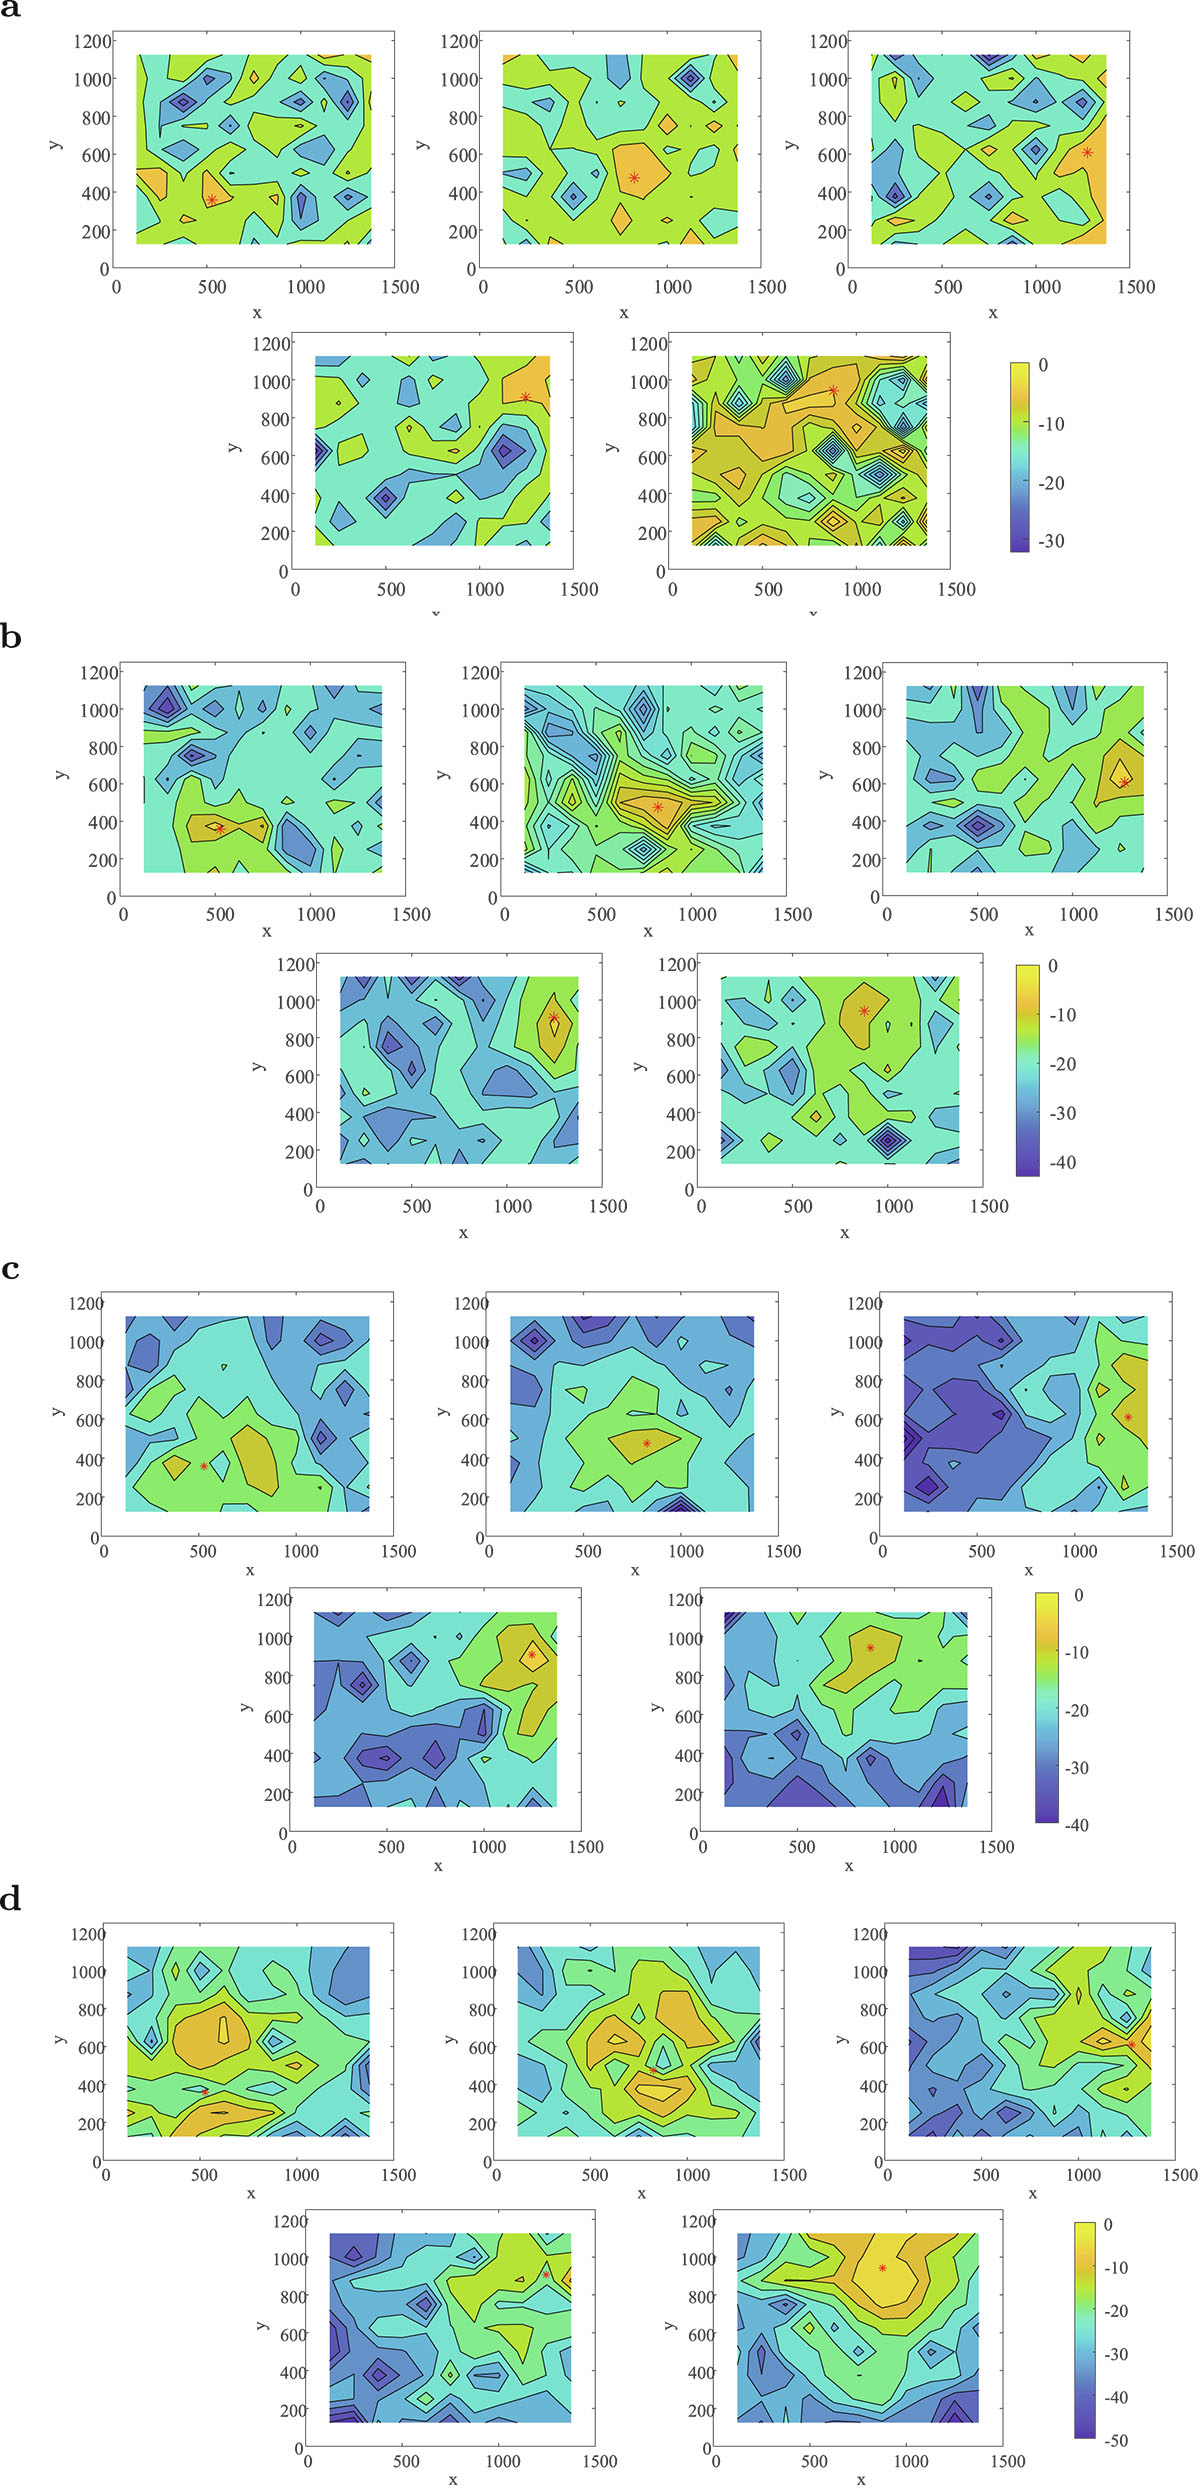
Download original image
Contour plot of the transfer mobility (magnitude) in decibels normalized to the highest value on the surface. The response positions for the accelerometer are on the Perspex plate with five different excitation positions for the force hammer (indicated by the red * symbol) on the Aluminium plate. Results are shown at the following narrow band frequencies: (a) 125 Hz, (b) 500 Hz, (c) 1k Hz and (d) 5k Hz.
Current usage metrics show cumulative count of Article Views (full-text article views including HTML views, PDF and ePub downloads, according to the available data) and Abstracts Views on Vision4Press platform.
Data correspond to usage on the plateform after 2015. The current usage metrics is available 48-96 hours after online publication and is updated daily on week days.
Initial download of the metrics may take a while.